U.S. exchange-traded funds absorbed net inflows at record annual rates through 2024-2025, with equity ETFs alone taking in hundreds of billions of dollars a year and single trading days routinely moving tens of billions, per fund-flow trackers — a tide of money whose daily readouts have become financial media's favorite sentiment dial. The dial measures something real, but not what headlines usually claim. Market Today publishes information, not investment advice, and this explainer covers what ETF flows are, what they can tell you, and the traps in reading them.
What is an ETF flow, mechanically?
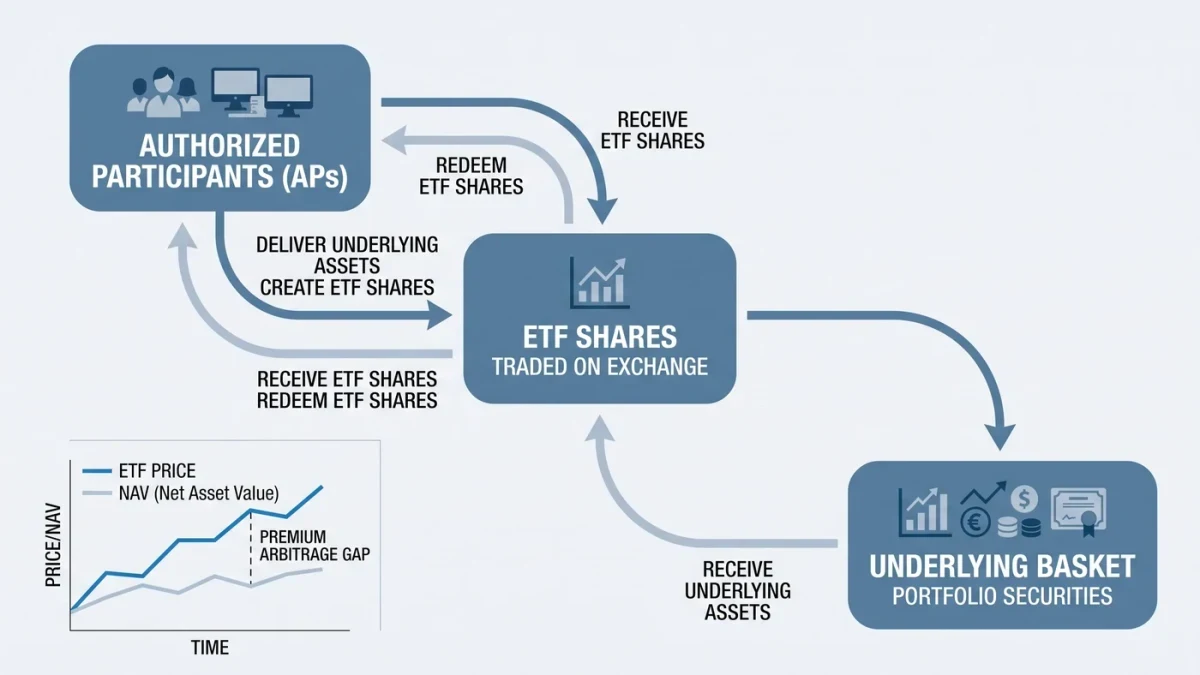
Net share creation minus share destruction. ETFs are unique among funds in their creation-and-redemption mechanism: when investors buy more of an ETF than sellers offer, specialized intermediaries — authorized participants — create new shares by delivering the underlying basket to the fund; when selling overwhelms buying, shares are redeemed and the basket flows out. "Inflows" therefore mean the fund's assets under management grew through net share creation — which requires the authorized participant to buy the underlying stocks. The published daily flow numbers aggregate these creations and redemptions across thousands of funds, and they are a record of positioning, not opinion: actual money crossed actual spreads to be counted.
Why did flows become the market's dominant vehicle?
Cost and tax structure, compounding for three decades. ETFs generally carry lower expense ratios than traditional mutual funds, trade intraday like stocks, and — their decisive American advantage — distribute capital gains far more rarely, because the creation-redemption mechanism removes appreciated holdings from the fund without triggering a taxable sale, per the tax treatment fund documents describe. Assets migrated accordingly: U.S. ETF assets grew from under one hundred billion dollars in 2000 to over ten trillion by the mid-2020s, while equity mutual funds bled assets over the same span, per industry tallies. The migration means ETF flows increasingly measure the entire market's savings behavior — which raises the stakes on reading them correctly.
What do flows correlate with, honestly?
Two well-documented patterns and one caution. Pattern one: flows follow performance. Money chases winners — the largest inflows cluster into recent top performers, and bond funds see inflows after bond rallies, a behavior documented across fund-family studies going back decades in the mutual fund data and now replicated in ETFs. Pattern two: contrarian extremes. The largest aggregate inflow weeks have historically clustered near sentiment highs, and outflow panics near lows — retail flow in aggregate behaves with a mild negative-expectancy timing pattern, per academic studies of fund flows versus subsequent returns. The caution: correlation is not mechanism. Flows do not push prices by themselves — the creation mechanism means an inflow buys the basket at market prices that already reflect demand — so flows and prices co-move through investor behavior, with causation running mostly from mood to both.
What can flows genuinely tell you?
Four reads with evidence behind them. Positioning: cumulative flows into a category — semiconductor funds, bitcoin funds, short-term bond funds — measure where risk appetite actually went, months before performance tables make it obvious. Extremes: record one-week inflows or outflows in volatile categories mark sentiment readings that historically mean-revert, not infallibly but measurably. Structure: the persistent rotation from mutual funds to ETFs, and from active to passive wrappers within each, is visible in the flow data and tells a decade-long structural story independent of markets. Dispersion: when a handful of mega-cap-focused funds absorb most inflows while broad-market funds lag, the market is voting for concentration — a fact this publication's index-concentration analysis connects to portfolio risk. Each read uses flows as a thermometer of behavior; none uses them as a forecast.
What are the classic misreadings?
Three recur weekly. Misreading one: "big inflows mean the rally continues." Inflows are concurrent with prices and follow momentum; the correlation says nothing about continuation — the record-inflow weeks of 2021 preceded a bear market, and the panic outflows of late 2023 preceded a rally, per flow data. Misreading two: "outflows from stock funds mean investors are fleeing equities." Category outflows often mean migration — money leaving expensive broad funds for cheaper ones, or mutual funds for ETF wrappers — with identical equity exposure; the asset class did not lose the money, the wrapper did. Misreading three: flow headline arithmetic on days of big market moves, which double-counts: when the market falls two percent, ETF assets fall two percent mechanically, and naive "money left the market" calculations conflate price change with redemption. The published flow series strips this, but derived commentary often does not.
How do flows interact with market structure?
Through the authorized participants' arbitrage, flows transmit into underlying markets efficiently — and that transmission has become the plumbing of the equity market itself. Because creations and redemptions route baskets through the underlying stocks, ETF flows now constitute a large share of daily equity trading volume in the largest names, and the closing auction — where creations settle — carries an increasing share of total volume, as this publication's rebalancing analysis covered. Two structural consequences get regulator attention: intraday flash dislocations, when an ETF's price briefly departs from its basket's value during stress — most famously during the 2010 Flash Crash — and the growing correlation between ETF trading and the underlying market's own liquidity cycles. The system has functioned through every stress test so far; its critics' warnings remain, appropriately, part of the SEC's ongoing market-structure review agenda.
What about the single-theme ETF boom?
The flow data's most colorful corner, and a documented cautionary tale. The 2020s brought hundreds of narrowly themed ETFs — single commodities, single trends, leveraged and inverse structures — whose launches cluster after themes run hot, per launch data. The pattern that follows is consistent: launch at peak interest, absorb inflows from performance-chasing money, then bleed assets as the theme cools; several niche funds have closed within a few years of launching, returning capital to holders. The leveraged single-stock ETF wave of 2023-2025 extended the pattern to daily-reset mathematics that most buyers can't compound correctly in their heads. None of this is hidden — prospectuses disclose the mechanics — but flows into such funds measure enthusiasm with unusual precision, and enthusiasm's record as a timing indicator is poor.
For readers who want the fund-fundamentals layer — how expense ratios compound, how the creation mechanism prices intraday, what a prospectus obligates the manager to do — the SEC's investor resources cover the ground plainly. Flows make intuitive sense layered on top of that foundation; read without it, they invite exactly the narrative shortcuts this article has tried to fence off.
How should a disciplined reader use flow data?
As a behavior gauge, checked against position, not prediction. Track cumulative category flows over quarters to see where risk actually migrated. Treat record extremes as sentiment readings with mean-reverting tendencies, not trend confirmations. Correct wrapper-migration stories before concluding asset-class conviction. And always pair flow reads with valuation: money flowing into an expensive category is enthusiasm measurable in dollars; whether enthusiasm is rewarded depends on the prices paid — which flows, being volume without judgment, never tell you. The thermometer is honest; it simply answers a different question than the one hopeful readers ask it.
Where can readers get the numbers?
Flow data publishes daily from the fund companies and weekly from industry trackers; the Investment Company Institute aggregates the authoritative mutual-and-ETF series; individual fund creations and redemptions appear in filings and exchange data. The raw material is free and current — and reading it against the market's actual path for even a year teaches the last lesson faster than any explainer: flows document the crowd, and the crowd's destination is not the crowd's wisdom.
A practical footnote for taxable investors: flows interact with tax seasons in ways that add noise every spring — year-end distributions, January repositioning, and April refund-season deposits all leave footprints in the weekly series. Recognizing the calendar's rhythm prevents the classic spring error of reading mechanical tax-flow patterns as fresh conviction.