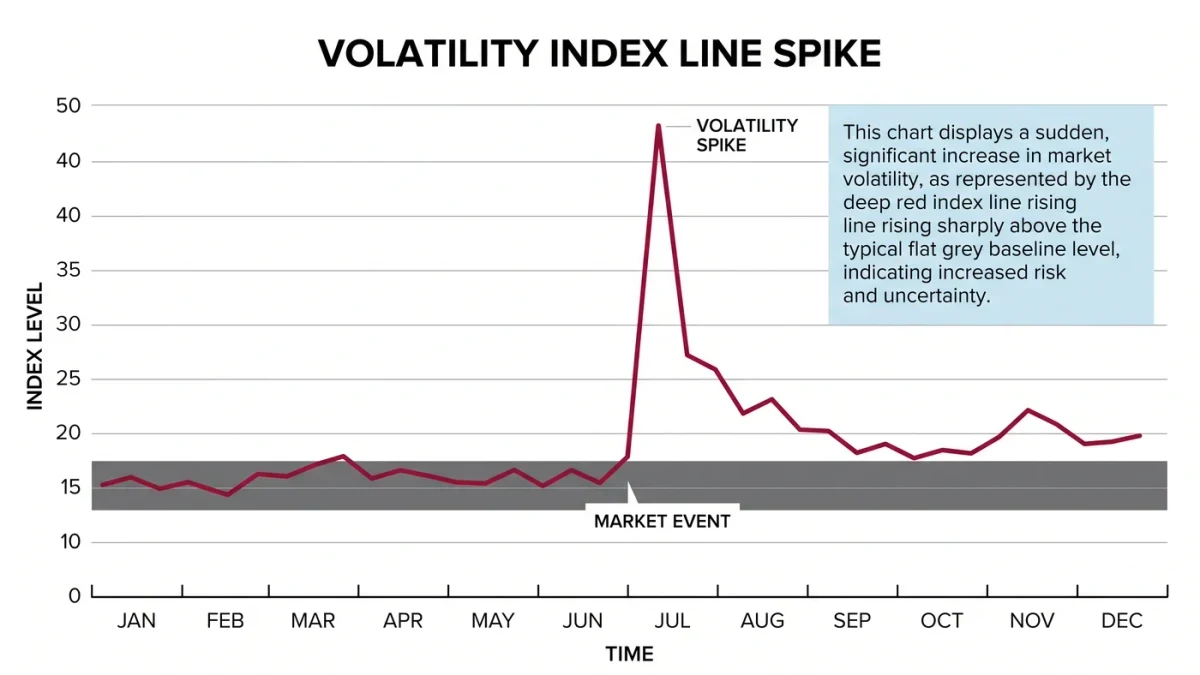
The Cboe Volatility Index — the VIX — closed 2024's calm stretches in the low teens and spiked above sixty during the August 5, 2024 global selloff, per Cboe data: a fourfold move in days that repriced hedging costs across every American equity market. Understanding what the number actually measures separates informed readers from headline consumers.
What does the VIX actually measure?
Expected movement, priced by real money. The index is computed from the prices of S&P 500 index options — specifically, a weighted blend of out-of-the-money put and call prices across a range of strikes on the two nearest expirations — and expressed as annualized expected standard deviation of the S&P 500 over the next thirty days. A VIX of 20 means the options market prices roughly a one-in-three chance the index moves more than twenty percent, up or down, over a year — or about 1.25 percent on a typical day. Because options are traded contracts with money at stake, the VIX is a market forecast, not a model's opinion or a survey: it is what hedgers and speculators, jointly, are paying for future movement right now.
Why is it called the fear gauge?
Because demand for protection spikes with anxiety. When investors fear declines, they buy put options; when they fear missing rallies, they buy calls; both purchases lift option prices and therefore the VIX. The index's structure makes it symmetric in theory but fear-tilted in practice: crashes are sharper than rallies, so the biggest VIX episodes are panics. The label stuck in the 1990s when the index was born, and it is half-accurate — the VIX measures the price of insurance against movement in either direction, and fear is simply when insurance sells fastest.
How is the calculation built?
From a full strip of option prices, not a single contract. Cboe's methodology selects S&P 500 options across many strikes for two nearby expirations, computes a weighted variance measure that strips out the risk-free rate and dividend effects, interpolates between the two expirations to a constant thirty-day window, and takes the square root to express the result in annualized volatility percentage points. The published methodology means the index is reproducible: given the same option prices, any reader computes the same number. This transparency is why the VIX became the global standard for volatility pricing and why its cousin measures now exist for other assets and horizons around the world.
What does the VIX's history show?
Long calm, violent interruptions. The index's long-run typical range sits in the high teens to low twenties, with sustained low-volatility stretches — the mid-2010s and 2017 ran months below twelve — punctuated by spikes: the 2008 financial crisis above 80, its all-time closing high; the 2020 pandemic crash above 80 again; the 2018 Volmageddon episode above 50; the August 2024 episode in the sixties after a yen-carry unwind and weak jobs data collided. Two structural observations from that record: VIX spikes mean-revert faster than almost any major market series — elevated fear is expensive to sustain — and each crisis has produced permanent changes in the products and flows around the index itself. The typical pattern deserves naming: spikes decay along a half-life of weeks, calm stretches last quarters, and the transitions between regimes arrive faster than positioning can adjust — which is, in one sentence, why volatility trading exists as a discipline and why it bankrupts the over-leveraged on both sides of the cycle.
What happened in the Volmageddon era?
Products built on the index changed the index — a loop worth understanding. The 2010s saw explosive growth in exchange-traded products that shorted volatility, harvesting premium from the VIX's tendency to fall after spikes. On February 5, 2018, a modest equity decline triggered a VIX spike that more than doubled in a session, destroying several inverse-volatility products overnight and forcing their sponsors to wind them down, per Cboe data and product filings. The episode taught the mechanical lesson: when instruments with rebalancing rules meet an index computed from options under stress, flows can amplify the very move being measured. The products were re-engineered with more leverage headroom, but the loop — volatility-of-volatility — remains a permanent feature of the modern market.
Why does the VIX usually spike when stocks fall?
Leverage cascades and dealer positioning, mostly. Falling prices trigger margin calls and de-risking, which raises demand for puts; dealers who sell those puts hedge by selling futures, accelerating the decline; and the combination lifts option prices — the VIX — precisely when equities fall hardest. The inverse relationship is therefore structural, not psychological alone: the same flows move both markets in opposite directions. In 2024-2025 a new wrinkle emerged: dealer gamma from massive index-option selling, especially the increasingly popular zero-day options, has repeatedly damped daily moves for weeks — the market's "gamma lockup" — and then released abruptly, which is one reason the era combines long calm with sharp air pockets, per positioning analyses published by derivatives researchers.
How does the futures curve extend the story?
The VIX itself cannot be bought — but VIX futures can, and their curve is where the index's information compounds. In calm markets the curve slopes upward: later months quote higher than the spot index, because insurance for distant quarters costs a premium and fear rarely stays this low. In genuine stress the curve inverts — spot spikes above deferred months, since the panic is now and markets expect it to pass — and the degree of inversion is one of the fastest single reads on how dislocated hedging markets have become. August 2024 printed a textbook inversion: spot in the sixties while later 2024 and 2025 months quoted far lower, the market stating in prices that it expected the episode to be weeks, not quarters. Curve-watchers got that call right within days.
What are the VIX's honest limitations?
Four worth naming. It measures thirty-day expectations only — longer-horizon fear quotes from the term structure of VIX futures, a different instrument. It is a price, not a probability: option prices embed risk premiums, so the VIX almost always sits above subsequently realized volatility — the variance risk premium — and the gap is compensation, not error. It covers the S&P 500: single stocks, other asset classes, and non-American markets have their own measures, which can and do diverge. And in genuine dislocations it can quote stale or distorted — August 2024's opening print briefly exceeded 100 in early trading chaos before settling in the sixties — because it is computed from options whose own markets were disrupted. A gauge is only as good as the market it reads.
How should readers use the number?
As context, not prophecy. Levels tell regime: low teens suggest complacent option pricing, high twenties-plus elevated hedging demand; the VIX futures curve's shape — upward-sloping in calm, inverted in stress — carries additional information about how long the market expects fear to persist. Long-run evidence is clear that using the VIX to time markets fails as often as it works; the number's honest use is as a thermometer of the cost of insurance and the market's own expectation of movement. Thermometers are useful precisely because they do not pretend to be forecasts.
Where can readers verify everything?
Cboe publishes the VIX's full methodology, historical data, and its family of related indexes on its site; the 2018 and 2024 episodes are documented in exchange data and product filings. The number quotes in real time during market hours, and its calculation, being public, rewards any reader who wants to understand exactly what the fear gauge fears.
For readers who want the option-market fundamentals underneath — what a put or call actually obligates, and how its price embeds expectations — the SEC's investor education materials cover the mechanics plainly. The VIX is only as intelligible as the instruments beneath it, and those instruments reward the modest effort of understanding them.