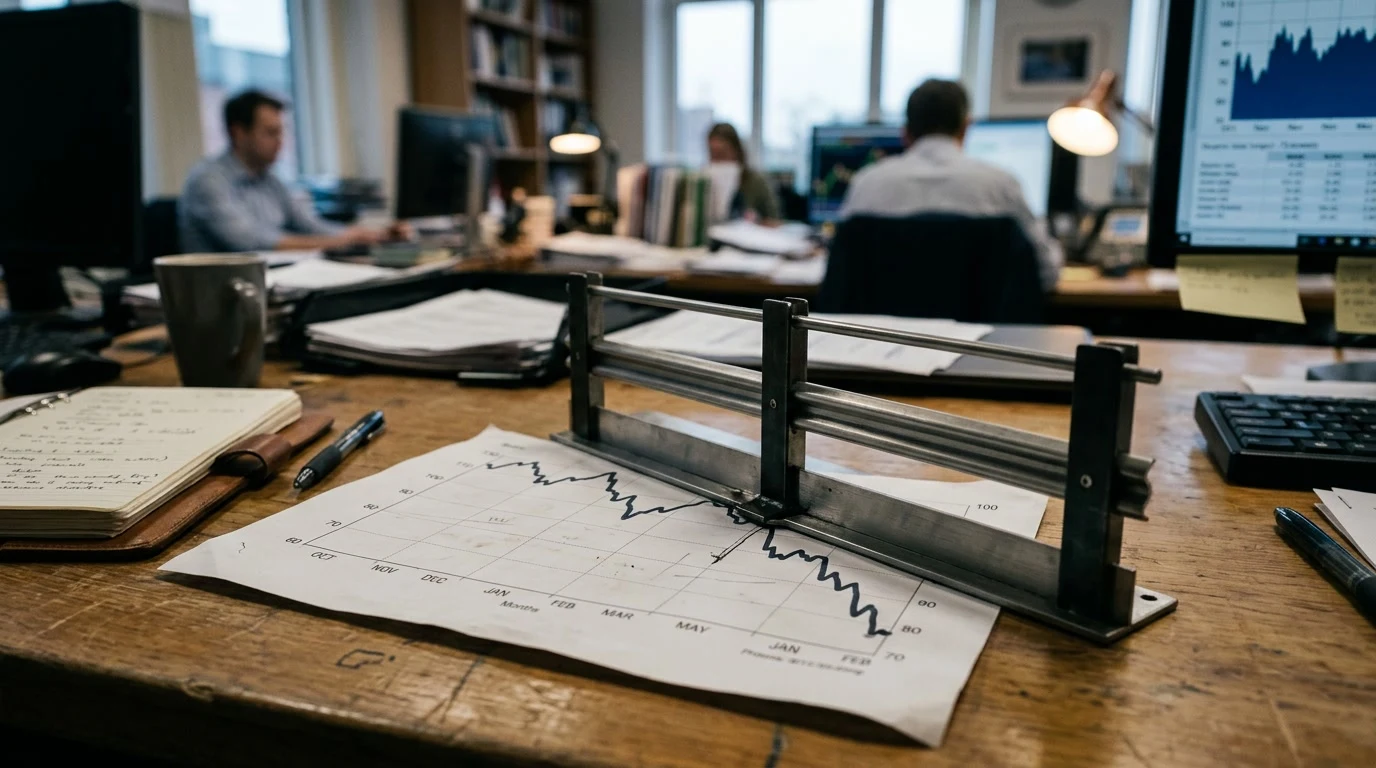
American equity markets halt all trading when the S&P 500 falls seven, thirteen, or twenty percent intraday — thresholds recalibrated in 2012 and last fully triggered on March 9, 12, and 16, 2020, per exchange records. The rules ran as designed in the fastest crash in history.
What are the market-wide circuit breakers?
A three-rung ladder of mandatory trading halts keyed to the S&P 500's decline from its previous close. Level one, a seven percent drop before 3:25 p.m. Eastern, halts all stock trading for fifteen minutes. Level two, thirteen percent under the same time rule, another fifteen-minute halt. Level three, twenty percent at any time, stops trading for the remainder of the day. The reference index is the S&P 500, not the Dow — a 2012 modernization (the pre-2012 rules used the Dow and different thresholds) following the SEC's post-2010 Flash Crash review. The thresholds are calculated daily from the prior close and published in advance, so every participant knows the exact levels before the open — a deliberate feature: predictable stop points are supposed to slow panic better than surprise ones.
Where did the idea come from?
From October 19, 1987 — Black Monday, when the Dow fell 22.6 percent in a session and the market's own mechanics amplified the collapse, per contemporaneous exchange records and the subsequent Brady Commission report. Portfolio insurance — a strategy that mechanically sold futures as prices fell — had turned a decline into a self-feeding spiral, and the Reagan-era commission recommended pre-set trading pauses as structural shock absorbers. The exchanges implemented coordinated breakers in 1988. The intellectual premise was straightforward: halts create forced time for information to arrive, prices in one market to reconcile with prices in another, and human judgment to reassert itself over automated deleveraging. Three decades of redesign followed each stress event — the 1997 seven-percent trigger, the 2010 Flash Crash's obscure single-stock chaos, the 2012 recalibration — an architecture revised whenever reality found a gap.
What happened in March 2020?
The only full-scale test of the modern ladder, and it behaved to specification. As pandemic panic arrived, the seven-percent level one triggered on March 9, the thirteen-percent level two on March 12, and on March 16 the market gapped down past every early threshold — but because the twenty-percent level three was touched after 3:25 p.m. (after which levels one and two no longer apply), the market traded to the close. Ten-minute and fifteen-minute halts also fired in futures markets under their own rules. The events demonstrated both halves of the design debate: the halts did not prevent the decline — the S&P 500 fell roughly thirty-four percent peak-to-trough in under five weeks — but the pauses coincided with orderly reopenings rather than cascading institutional failures, and the system's plumbing survived volumes it had never carried.
What are the single-stock rules?
A parallel, more intricate system operating continuously beneath the market-wide ladder. Since 2010-2013, every exchange-listed stock operates under limit-up-limit-down bands: when a stock moves beyond a percentage threshold from its recent average price over a rolling five-minute window, trading is restricted to that band, and if the strain persists, a five-minute halt follows. Tier-one stocks carry tighter bands than small caps, thresholds flex with volatility regimes, and the bands recalibrate in real time. These micro-halts fire routinely — dozens of times on volatile days — and their purpose differs from the market-wide ladder: they prevent broken prices in individual names from propagating through arbitrage links into indexes, the precise failure mode of the May 2010 Flash Crash, when some stocks traded at a penny while others at one hundred thousand dollars, per the SEC-CFTC post-mortem.
Do halts actually help? The evidence
The honest answer is contested, and both sides hold real evidence. The positive case: forced pauses give information time to arrive and interrupt mechanical cascades — the academic literature finds halts reduce temporary price dislocation around extreme moves, and March 2020's reopenings were orderly. The negative case: halts do not stop declines (2020 proved direction is untouched), they may merely postpone price discovery to a concentrated reopening moment, and the anticipation of halts can accelerate selling — traders rush for the exit before the door closes, a behavior documented around halt thresholds in academic studies. The philosophical divide is deeper: whether markets exist to provide continuous trading or accurate prices, and when those goods conflict. The current architecture is a compromise: short halts early in the day, none near the close (so price discovery can complete), and a full stop only at twenty percent.
What about markets beyond U.S. equities?
Every major market runs its own version, and the differences are instructive. U.S. futures markets — where much of the 2020 stress traded — maintain price limits on equity index products with coordinated CME rules. Commodity futures use daily price limits, some of which expanded after 2022's episodes, most visibly in the nickel crisis on the London Metal Exchange — which responded to a short squeeze in March 2022 not with standard breakers but by canceling trades and shutting the market for days, per the exchange's subsequent review, a decision that damaged its credibility and triggered lawsuits and rule rewrites. The nickel episode is the standing counterexample: improvised intervention in a derivatives market, however well-intentioned, can cost more trust than the halt it replaced.
What do halts mean for an ordinary investor?
Practically, three things. A halt pauses exchange trading but does not pause the world — news keeps arriving, overseas markets keep trading, and when trading resumes, prices gap to wherever the accumulated information puts them; the halt distributes the move over time, not away. Limit orders matter more on volatile days: market orders entering a reopening auction can fill at ugly prices, and the exchanges publish reopening mechanics precisely so investors can use limit protection. And long-term investors have the historical record on their side of patience: every Level-one day in U.S. history — 1997, 2020's three triggers — occurred within drawdowns that later recovered, per market data, though past recovery guarantees nothing about the next one, and honest analysis stops exactly there.
Could the architecture change again?
It always has, and two live pressures are visible. Speed: halts sized for human reaction times (fifteen minutes) interact oddly with machine-timescale markets — the 2010 and 2024 volatility episodes both featured flash moves that completed and reversed inside what a halt's reaction window would have been, and regulators have studied whether breakers should be shorter or differently structured for an algorithmic age. Linkage: halts in one market while related markets trade — stocks halted, futures open, options repricing — create the arbitrage strains the single-stock bands were built to manage, and the growing dominance of exchange-traded funds as the trading vehicle of choice adds a layer regulators examine closely, since an ETF can trade while its underlying names are halted. The SEC's market-structure agenda publishes these reviews openly; the architecture is public, argued over, and quietly evolving.
Where can readers verify the rules?
The current thresholds, their calculation, and the history of triggers publish through the exchange rulebooks and the SEC's approval orders; the 1987 Brady report, the 2010 joint post-mortem, and the 2020 trigger dates are all public documents. The rules that stop the market are, appropriately, among the most documented rules in finance — reading them takes an hour and rewards every volatile day thereafter.
One closing distinction guards against misunderstanding: a circuit breaker is not a circuit repairer. Nothing about a fifteen-minute pause fixes the news that caused the decline or the leverage that amplified it; the machinery merely guarantees that the repricing happens in intervals rather than all at once. Investors who treat halts as safety rails rather than solutions keep the right mental model — the rails limit the wreckage's speed, and the road is still the road.