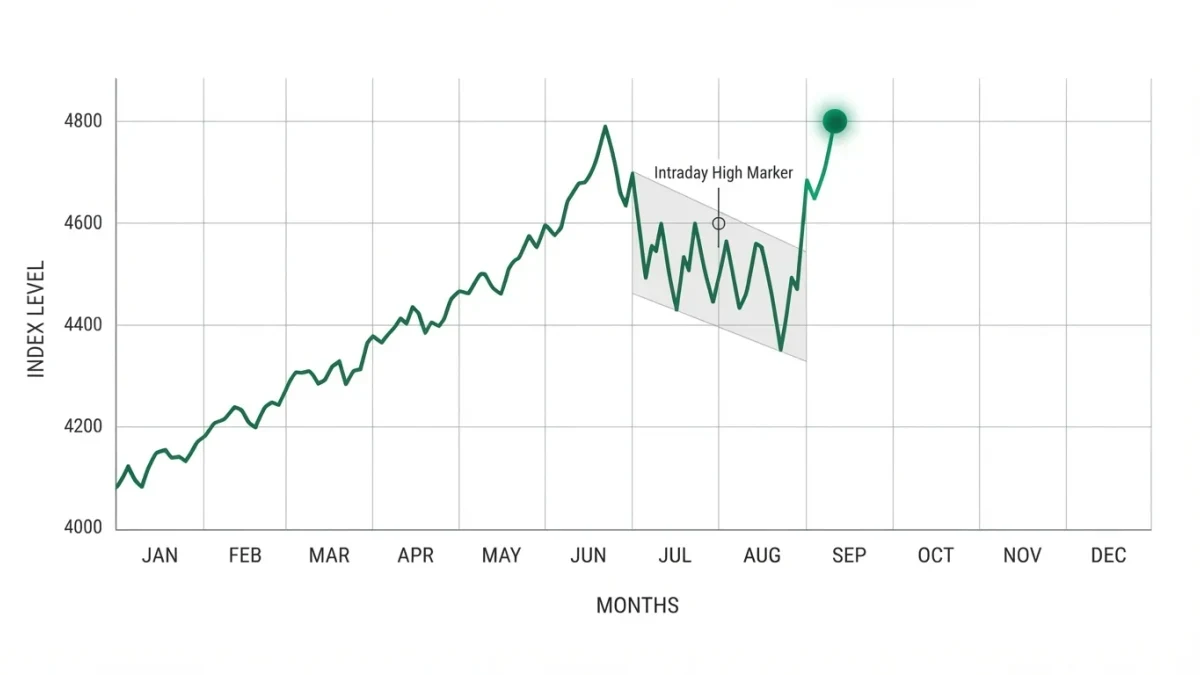
The S&P 500 closed at a record 7,736 on August 4, 2026, rising 1.79 percent for its first new all-time high since June 2 and its twenty-fifth record close of the year, per exchange closing data — capping a recovery from a two-month stretch in which momentum strategies suffered a sharp unwind. Market Today publishes information, not investment advice; this is a factual account of the move and the mechanics beneath it.
What actually happened?
Four sessions of broad buying added roughly 3.7 trillion dollars to U.S. equity market value through August 4, per market-data tallies of the period, driven by stronger-than-feared corporate earnings and easing geopolitical concerns — including reports of progress toward an Iran peace framework — after a summer in which the index had set an intraday record near 7,700 on July 6, pulled back through late July amid a momentum-crash episode, and climbed again into month-end. The August 4 close at 7,736 confirmed what the July 21 session (up 0.40 percent, with the Nasdaq up 1.36 percent) had hinted: the drawdown's buyers had outweighed its sellers.
What was the momentum crash?
A two-month unwind of crowded trend-following positions, not a macro recession signal. Momentum crashes — sharp reversals in which previously leading factor positions collapse as positioning unwinds — are a documented market phenomenon, and the June-July 2026 episode followed the pattern: strategies long the year's winners were forced to deleverage, pressure that briefly pushed the index well below its June 2 record before earnings season provided a fundamental floor. The investors rewarded on August 4, as market commentary widely noted, were those who held through the unwind rather than those who traded it.
Why do earnings and geopolitics matter at the margin?
Because record highs are set at the margin of expectations. The second-quarter reporting season concluding in early August delivered results that beat the lowered bar set during the summer pullback, removing the earnings-risk discount the market had carried; simultaneously, signs of de-escalation in the Middle East reduced the risk premium embedded in energy prices and in equity valuations. Both forces operated through expectations rather than levels — which is why the same index could sit roughly six percent below a record in mid-July and above it three weeks later without the economic picture transforming.
What context did the coverage skip?
Two items. First, the record's narrow arithmetic: as this publication has documented, index concentration means record closes can arrive on the strength of a handful of mega-caps even while the median stock trails — the breadth of this particular rally, not just its headline, determines its information content, and equal-weight-versus-cap-weight performance during the recovery is the number worth checking. Second, the positioning lesson: momentum unwinds historically end with trend-followers re-entering, which can extend rallies mechanically after the fundamental catalyst — a pattern readers should watch in positioning data rather than assume.
What happens next, factually?
The index's level is public daily; the July inflation report arrives on the standard mid-August schedule, and its reading will test the easing-rate narrative that helped drive the recovery. Readers should treat the record as what it is — a price fact confirming renewed risk appetite — and verify breadth and positioning in the published data before drawing conclusions about durability, in either direction.