North America's major freight railroads report carloads and intermodal units every single week, and the weekly series has flagged turns in goods demand before several recessions — including double-digit percentage drops in carloads during the 2008–2009 contraction, per Association of American Railroads data. The gauge is unglamorous, timely, and almost nobody on television mentions it.
What exactly does the AAR weekly report count?
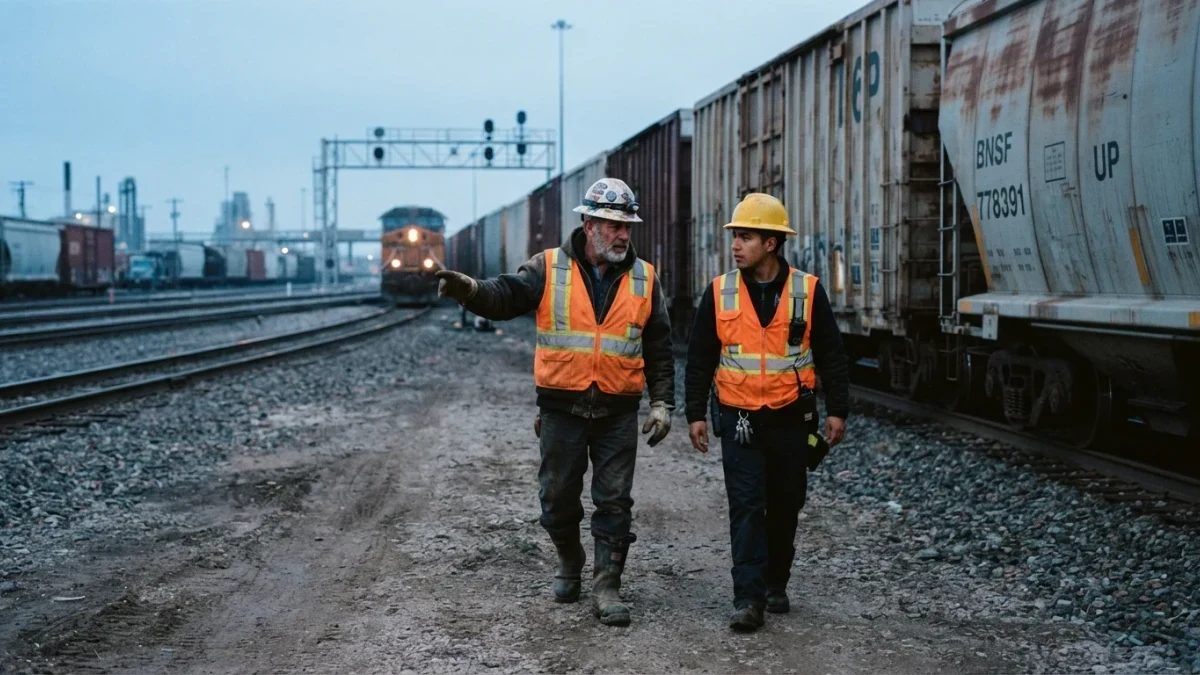
Two families of numbers. Carloads measure physical train cars of bulk commodities — coal, chemicals, grain, motor vehicles, crushed stone — while intermodal units count containers and truck trailers moving on rail, which proxy consumer packaged goods and imports. The Association of American Railroads publishes totals for U.S. Class I railroads, plus North American aggregates including Canada and Mexico, every Wednesday for the prior week. Because the count is of physical objects already moved, not opinions or intentions, it lands closer to ground truth than most surveys, and its weekly frequency catches inflections months before quarterly data can.
Why is freight a leading rather than lagging signal?
Because of where rail sits in the supply chain. Goods are railed before they are sold: chemicals become products, grain becomes food, intermodal boxes become store shelves. When end demand softens, the first corporate response is usually to stop reordering, which empties rail traffic weeks before it shows up in revenue or payrolls. Rail management confirmed this ordering in their own commentary during past downturns — volumes led pricing, and pricing led earnings. The chain runs one direction: physical freight moves first, financial results follow, and Wall Street's modeling of the railroads themselves tends to arrive last.
Inventory behavior explains the timing better than any metaphor. American supply chains run on weeks of stock rather than days, so a retailer that sees demand soften can simply pause purchase orders and live off existing shelves; the rail cars that would have carried the reorders simply never get summoned. By the time the retailer's own revenue guidance concedes the slowdown, the rails have been counting the absence for a quarter.
What did the rail data show in past recessions?
The record is consistent across modern cycles, with honest caveats. U.S. rail carloads fell on the order of fifteen to twenty percent peak-to-trough during 2008–2009, per AAR historical data, and intermodal dropped by similar magnitudes, marking the goods recession before GDP prints confirmed it. In 2020 the pandemic collapse was sharper and shorter — carloads fell by double digits within weeks. In softer cycles like 2015–2016, the declines were mid-single-digit but visible a year ahead of the industrial downturn's trough. The caveat deserves equal billing: rail measures goods, not services, and an economy that is now majority services can slow sharply while boxcars roll on schedule. That is the indicator's blind spot, stated plainly.
What are the series' structural distortions?
Three, and ignoring them produces false readings. Coal has been declining for structural reasons — power plant retirements — so a falling coal carload count says nothing about the cycle; analysts strip it out. The same applies to a second distortion: network events, from hurricanes to labor actions such as the 2022 nationwide rail negotiation, which suppressed and then released volumes independent of demand. Third is the long-running shift of some bulk traffic to trucks and pipelines, a slow leak that biases year-over-year comparisons downward even in expansions. The clean read uses core categories — intermodal, chemicals, motor vehicles — with coal quarantined and event weeks footnoted.
How did the post-2022 period test the indicator?
It handed the series its most instructive decade. Goods demand collapsed from pandemic highs in 2022 as spending rotated back to services, and intermodal fell roughly ten percent from its 2021-22 peak into 2023, per AAR data — a goods recession visible on the rails while headline GDP kept growing on services strength. Then 2024 brought a fragile goods recovery, with intermodal grinding to record annual volumes by some measures as imports surged ahead of tariff actions, and 2025's freight books told a mixed story of port-frontloading and uneven industrial demand. Through all of it, the weekly counts described the goods economy accurately; the mistake would have been reading them as a proxy for the whole economy. The series rewards users who respect its scope.
How should a reader actually use it?
With discipline and a spreadsheet. Watch the year-over-year change in intermodal and in ex-coal carloads over rolling thirteen-week windows, which smooths weekly noise; compare against the Cass Freight Index and trucking data for confirmation; and treat divergences as questions rather than verdicts. A services-led slowdown with resilient freight is a different economy from a goods-led one with collapsing boxes, even at identical GDP. The rail data answers only its own question — how much stuff is moving — but it answers it weekly, physically, and without a press release.
Where can readers pull the numbers themselves?
The AAR publishes weekly and monthly traffic releases on its site, the Surface Transportation Board holds industry filings, and railroads' own investor materials disclose volumes by segment. All the claims above trace to those public series, and any reader can maintain the chart for the cost of an hour a month — which is rather less than the sell-side charges for the same arithmetic.
Used that way, the series also disciplines narratives. Claims that "the consumer is collapsing" have to survive the intermodal table; claims of an industrial renaissance have to survive chemical and motor vehicle carloads. Most years, the rails quietly refute at least one confident thesis — which is precisely what a gauge is for.