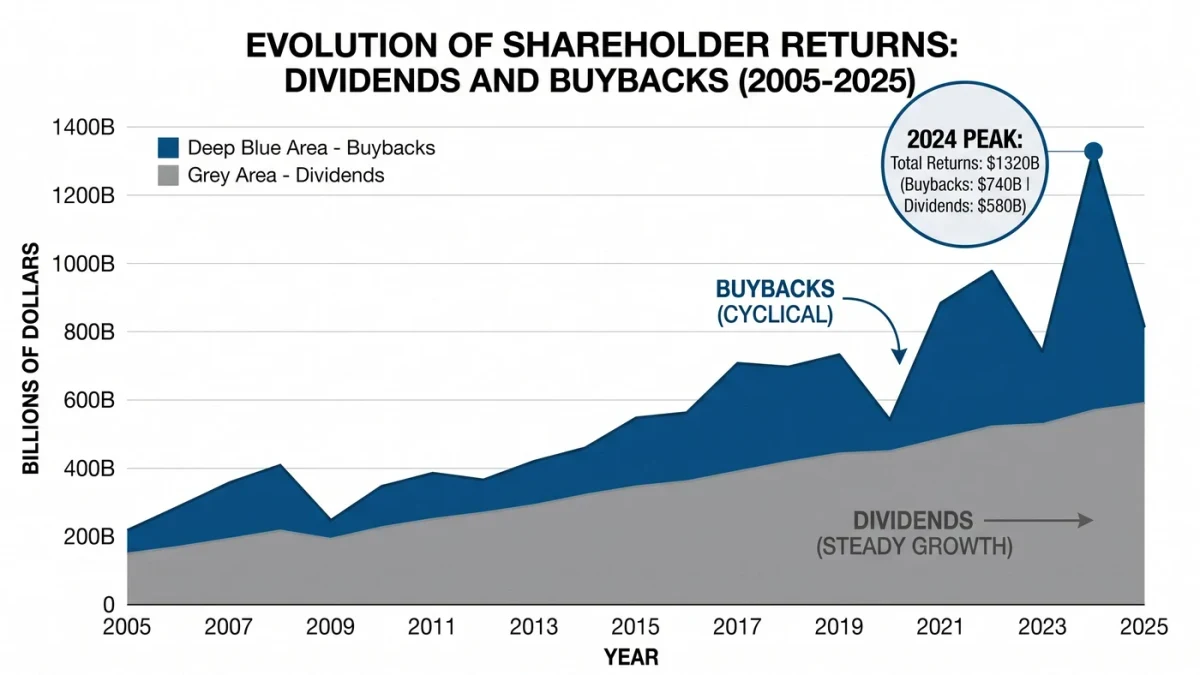

America's large companies repurchased more than six trillion dollars of their own stock over the decade through 2025, per S&P Dow Jones Indices buyback data — and the S&P 500's share count shrank by roughly two percent annually through much of that period, meaning a meaningful slice of the index's famous per-share earnings growth was subtraction, not addition. Buybacks are neither villain nor free lunch; they are arithmetic with conditions. Market Today publishes information, not investment advice, and this explainer covers the mechanics, the evidence on when buybacks create or destroy value, and how to read them in filings.
What is a buyback, mechanically?
A company spending cash to repurchase its own shares from the market and retire them. The repurchased shares cease to exist, so total earnings divide across fewer shares: EPS rises automatically whenever shares are retired, whatever net income does. That is the entire engine — per-share growth without pre-dollar growth — and it is perfectly visible in every 10-K's share-count line. Companies announce buyback programs authorizing a maximum dollar amount, then execute through open-market purchases over quarters; the authorization is permission, not a promise, and announced programs complete at rates well below one hundred percent, which is why the announcements column and the executions column tell different stories.
How much of EPS growth is buybacks?
Through the 2010s and 2020s, roughly one to two percentage points a year at the index level — the difference between net-income growth and EPS growth, per S&P index data. In a year when net income grows eight percent and the share count falls two percent, EPS grows about ten percent; headlines celebrate ten, and two of it was the company buying its own denominator. The effect compounds: a share count falling two percent annually for a decade leaves EPS some twenty percent higher than net income alone would have produced. None of this is hidden — the share-count table in every annual report prints it — but per-share figures dominate coverage, and the denominator quietly does its work under the applause.
When do buybacks create value?
The academic consensus is narrower than corporate press releases suggest: buybacks create value when shares are repurchased below intrinsic value, when the cash used has no better employment, and when the alternative is value-destroying empire building. A company with mature, stable cash flows, no high-return projects left at scale, and a cheap stock converts excess cash into per-share value efficiently — this is the Berkshire Hathaway argument made by Warren Buffett in his annual letters, which is why buyback analysis and valuation analysis are inseparable. Buybacks funded with debt at cycle-top prices do the reverse: they lever the balance sheet to retire shares at the worst prices, converting shareholder cash into value destruction with excellent public relations.
How did the era of trillion-dollar buybacks run?
Record programs became the post-2017 norm. The 2017 tax reform repatriated overseas cash and triggered announcement waves — Apple alone executed buybacks at rates exceeding eighty billion dollars annually in peak years, per its filings — and annual S&P 500 totals ran above eight hundred billion in peak years, interrupted only by the 2020 pandemic pause when regulators restricted distributions, then resumed to fresh records. The 2021-2025 bull market was, in meaningful part, buyback-financed at the margin: companies were simultaneously the largest net buyer of equities in many quarters, per Federal Reserve flow-of-funds data — a persistent bid that dwarfed retail inflows in those windows and became a structural support the market priced as reliable.
What is the buyback-versus-dividend debate?
Two distribution channels with different personalities. Dividends are commitments: cutting one is a signaling event markets punish, so boards set them at sustainable levels and raise them grudgingly — the dividend aristocrat culture institutionalizes this. Buybacks are discretionary: scaled up in good times, quietly slowed in bad ones, with no stigma attached, which makes them the flexible half of payout policy. The tax treatment differs across jurisdictions and shareholder types; the signaling differs even more — a raised dividend says permanence, a buyback says opportunity. The evidence does not crown a winner: total payout policy matters more than its composition, and companies that use both — dividends as the floor, buybacks as the sweep of excess cash — dominate the mature-large-cap population for structural reasons.
What are the honest criticisms?
Four with substance. The compensation channel: executive pay tied to EPS or share price gives management a personal incentive to buy back stock regardless of price — the incentive-conflict literature documents the association between buyback intensity and compensation design. The investment crowd-out: cash spent on repurchases is cash not spent on capex or R&D, and critics argue the era's buyback wave coincided with underinvestment in productive capacity; the counter-evidence notes that companies with the largest buybacks often also grew capex, and the aggregate investment data are contested terrain. The market-timing record: companies demonstrably buy back more at highs than lows — execution-weighted studies show repurchases clustering near price peaks — the opposite of value creation. And the mechanical bid argument: a persistent corporate buyer changes market structure itself, and a buyback slowdown in a weak tape removes support that was never contractual — the market's most quiet bid, gone precisely when bids are scarcest. Each criticism is evidence-backed; none abolishes the tool.
What about the 1% excise tax?
Policy reached the practice in 2022: the Inflation Reduction Act imposed a one percent excise tax on net repurchases, and Treasury issued its implementing regulations in subsequent years, per the agency's published guidance. The tax is small against the programs it touches — one percent of net buybacks changes the calculus at the margin, not the mechanism — but its symbolism cut both ways: critics read it as an official verdict on buyback excess, practitioners read it as a cost line to optimize, and the total flow of repurchases, by the S&P data, continued at high levels through 2023-2025 regardless. The episode's durable lesson is procedural: buybacks now carry a visible tax fingerprint in filings, one more line the reader can verify.
How do you read buybacks in the filings?
Four lines, quarterly. The share count: basic weighted-average shares in the income statement — if it is not falling, the buyback program is not executing, whatever the announcements said. The cash flow statement's repurchase line: actual dollars returned. The treasury-stock and equity sections: whether repurchases offset dilution from stock compensation — much of big-tech's buying exists merely to stand still against employee equity issuance, per the same filings' stock-compensation expense lines. And the announcement-versus-execution gap tracked across releases. Ten minutes with these lines converts buyback rhetoric into buyback arithmetic, and the arithmetic is the analysis.
A final cross-check guards against the subtlest trick in the genre: buybacks financed while the company issues new shares to executives. Some celebrated repurchase programs exist largely to absorb stock-compensation dilution — the share count barely moves — and the press release still celebrates the gross number. The net line is the honest one: what happened to total shares outstanding, full stop.
What is the disciplined verdict?
Buybacks are a distribution channel that borrows the vocabulary of investment. They create value under specific conditions — cheap shares, spare cash, disciplined prices — and destroy it under the opposites, and the difference is invisible in press releases and obvious in filings. The reader's rule: every EPS number should be read next to its share count, every buyback announcement next to its execution history, and every buyback-financed EPS growth story next to the net income that did or did not grow underneath it. The arithmetic is public; the discipline is the reader's.
Where can readers verify the numbers?
S&P Dow Jones Indices publishes the buyback index data quarterly; every company's repurchases, share counts, and treasury activity appear in its 10-Qs and 10-Ks on EDGAR; Federal Reserve flow-of-funds data shows the corporate sector's net equity position. The whole case — program to execution to EPS effect — reconstructs from free public documents, which is the standard this series holds.