The Consumer Price Index release moves markets faster than any other economic data: surprise CPI prints have shifted two-year Treasury yields by double-digit basis points within minutes and equity futures by a percent or more, per market data on release days, and same-day options volume now spikes around each 8:30 a.m. Eastern release. One statistical release, that much force — the anatomy is worth understanding. Market Today publishes information, not investment advice, and this explainer covers what the CPI is, how the market trades it, and where the number's limits lie.
What is the CPI, exactly?
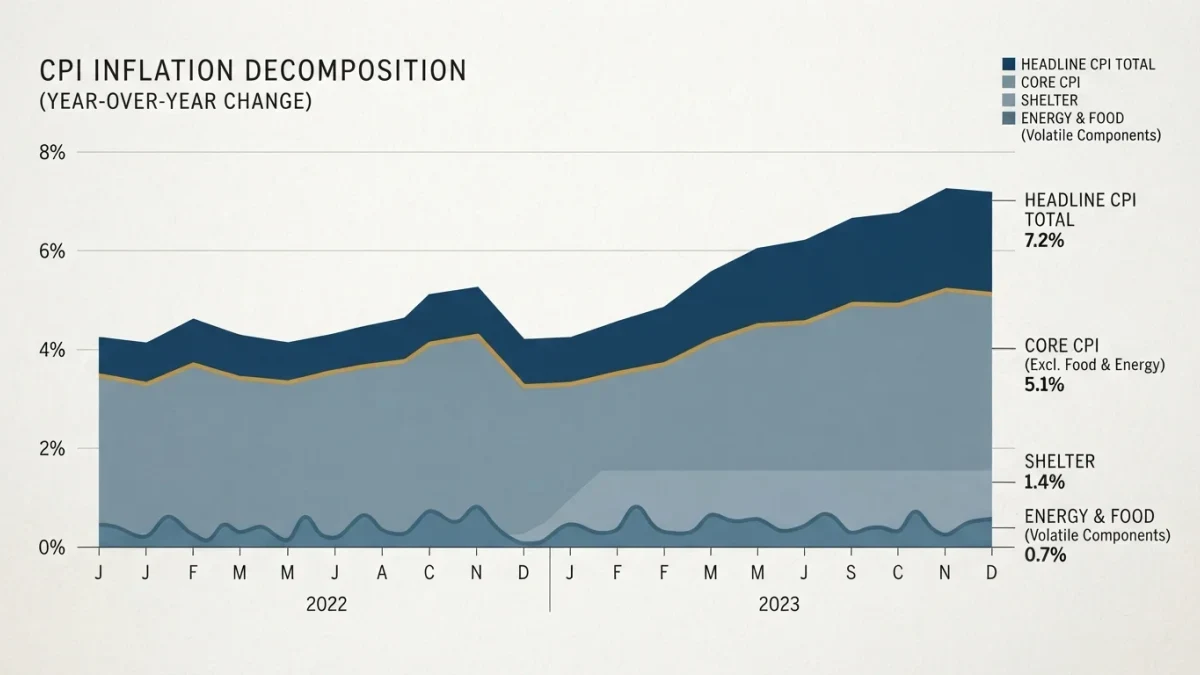
The Bureau of Labor Statistics' monthly measure of the average change in prices urban consumers pay, built from roughly ninety thousand price quotes across hundreds of categories — rent, groceries, airline fares, new cars, medical services — weighted by household spending shares from consumer expenditure surveys. The headline number is the twelve-month percent change; the monthly change matters just as much to markets. The core index strips food and energy — not because they do not matter, but because their month-to-month noise obscures the underlying trend the Federal Reserve targets — and the Fed's preferred gauge is actually a different measure, the personal consumption expenditures price index, which the CPI leads by a few weeks. The CPI's market primacy comes from timing and familiarity: it arrives first among inflation measures and has the longest history, so trading infrastructure and reaction patterns built up around it.
Why does the market react so violently?
Because the release resolves a live bet about the policy path. The Federal Reserve's mandate makes inflation the decisive input for rate decisions, so every CPI print updates the market's estimate of the future funds rate — and the entire rate complex, from two-year yields to mortgage quotes, reprices accordingly. Equities inherit the repricing through discount rates and growth expectations: higher expected rates compress valuations, especially for long-duration growth stocks. The reaction is to the surprise — the gap between the actual print and the consensus compiled from economist surveys — not the level: a hot 0.3 percent monthly core print when 0.3 was expected barely registers, and the same 0.3 against a 0.2 consensus can move markets for days. The 2021-2023 period ran the mechanism at full volume: a sequence of upside surprises forced the largest hiking cycle in four decades, and each release morning became a scheduled repricing event for every asset class.
What are the components the market actually reads?
Three lines inside the tables carry most of the information. Shelter — rent and owners' equivalent rent — is the largest component at roughly a third of the index, and its sluggish statistical structure (new leases feed into the index over months) makes it both the trend-setter and the laggard: the 2023-2025 disinflation was substantially a shelter story, as market rents from 2022's surge slowly worked through the index, per BLS methodology documentation. Core goods ex-food and energy track supply chains and tariffs — the 2025 tariff episode showed up here first, as goods prices that had deflated for years began firming, per release data. Core services ex-shelter — the Fed's so-called supercore — is watched as the wage-sensitivity proxy: it is the segment most tied to labor costs, and its persistence through 2024-2025 kept policy cautious. A disciplined CPI read names all three lines before rendering a verdict.
How do traders actually trade the release?
A choreography repeated eight to twelve times a year. Positions are sized down or hedged the day before — release mornings carry event risk too large for unhedged books. At 8:30 the numbers hit simultaneously to all subscribers; algorithms parse the headline, core, and components in milliseconds and reprice rates, equities, and the dollar before human traders finish scrolling. The first minutes establish the surprise's direction; the next hours test whether the initial read survives component analysis — a hot headline driven by volatile hotel fares reads differently from a broad-based 0.4. By afternoon, the market settles into the new expected policy path, and Fed funds futures reprice the probability of cuts at upcoming meetings. The same-day options market has industrialized the event, as covered in this publication's options analysis: defined-risk CPI bets now expire the same day they resolve.
How does the PCE report relate to the CPI?
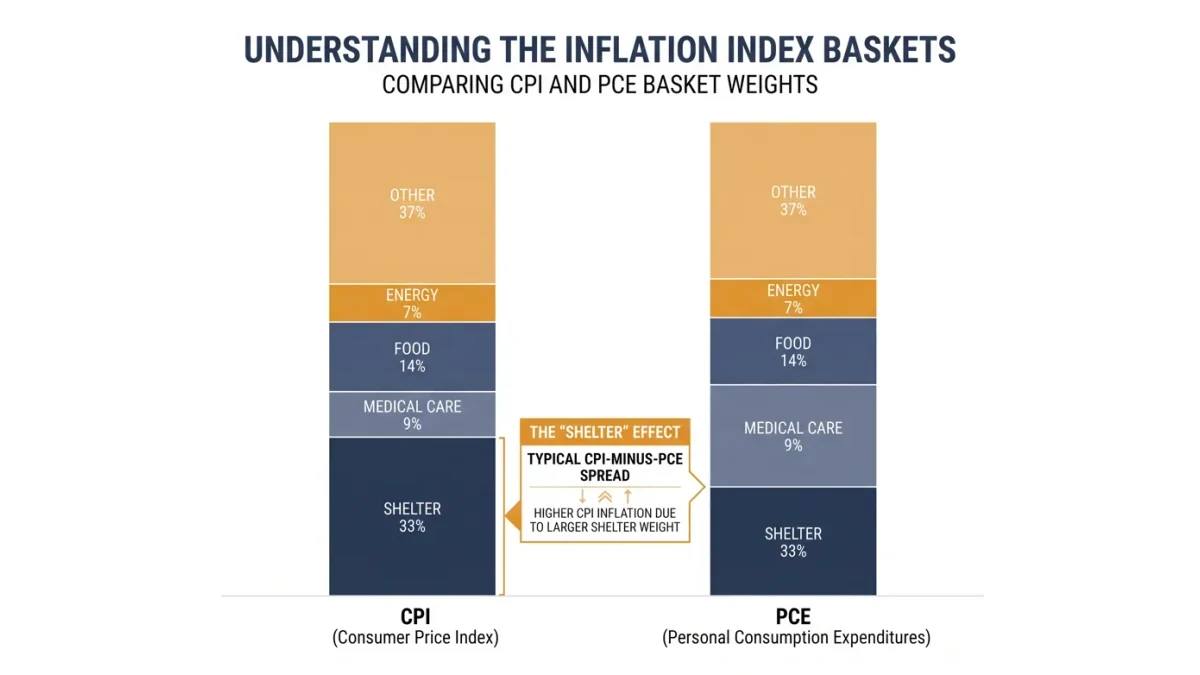
The Federal Reserve's stated target is measured by a different index — the personal consumption expenditures price index, published by the Bureau of Economic Analysis with the monthly income and spending data — and the two measures differ in construction in durable ways. PCE covers all spending including employer- and government-paid healthcare, weights update continuously rather than every two years, and its shelter share is smaller — which is why PCE inflation has run below CPI inflation in most recent periods, per both agencies' data. The market hierarchy persists anyway: CPI arrives earlier in the month, so it sets expectations, and PCE — released weeks later — confirms or revises the story. Traders who track both get a free lesson in measurement economics: same economy, different baskets, honest divergence, and a Fed that watches each for its own reasons.
What are the CPI's honest limitations?
Four deserve naming. It measures urban consumers' out-of-pocket spending — a specific, defensible construct that nonetheless differs from other countries' measures and from any individual household's experience. Its weights update with a lag, so composition shifts — the post-2020 goods-to-services rotation — reach the index late. Quality adjustment, the practice of stripping out improvements so a better computer does not register as a price increase, is methodologically sound but contested at the margins, and the BLS publishes its methods for exactly this scrutiny. And any single month is noisy: the BLS itself publishes standard errors, and readings within a few tenths of consensus are statistical ties that markets over-trade anyway. The number is a measurement, not an oracle; treating month-to-month wiggles as signals is the market's choice, not the statistic's claim.
How did the 2020s change CPI-day behavior?
Structurally, three ways. First, sensitivity: with inflation far from target through 2022-2025, each print carried policy consequences that the low-inflation 2010s never attached — a return toward the 1970s-80s pattern where inflation data, not employment data, was the main event. Second, the feedback loop: because Fed communications now lean on data dependence, the market parses not just the print but what it implies the Fed will say about the print — a second-order analysis layer that makes release days more interpretive than they were. Third, retail participation: commission-free platforms put the release in every phone's notifications, and the measured first-minute retail order flow on CPI mornings has grown enough for exchanges and researchers to track — the event is no longer institutional-only, which shapes its microstructure in ways still being studied.
What should a disciplined reader do with each release?
A repeatable checklist beats reaction. Read the monthly core change first — the trend lives there. Check shelter's contribution against the prior three months, because its momentum determines how fast headline disinflation can run. Look at core goods for tariff pass-through, and supercore services for wage pressure. Compare the twelve-month rate against consensus expectations, not against zero — the market prices progress relative to expectation. And note the release's implications for the next Fed meeting's probabilities in funds futures rather than in commentary adjectives. The whole checklist takes ten minutes with the BLS release and a futures quote, and it outperforms the reflex of trading the first headline number.
Where can readers get the number directly?
The Bureau of Labor Statistics publishes the full CPI release — tables, components, shelter detail, standard errors, methodology — free at bls.gov at 8:30 a.m. on release days, with the schedule posted a year ahead. Reading the primary release rather than the reaction coverage is the single highest-value habit this explainer can recommend; the market spends billions reacting to tables any reader can open at the same moment.