The ten-year Treasury yield moved from below one percent in 2020 to nearly five percent in October 2023 — one of the widest ranges in modern bond history — driven by four engines that pull in different directions on any given day, per Treasury market data. Most commentary attributes each move to one headline; the mechanics are more layered.
What is a Treasury yield, fundamentally?
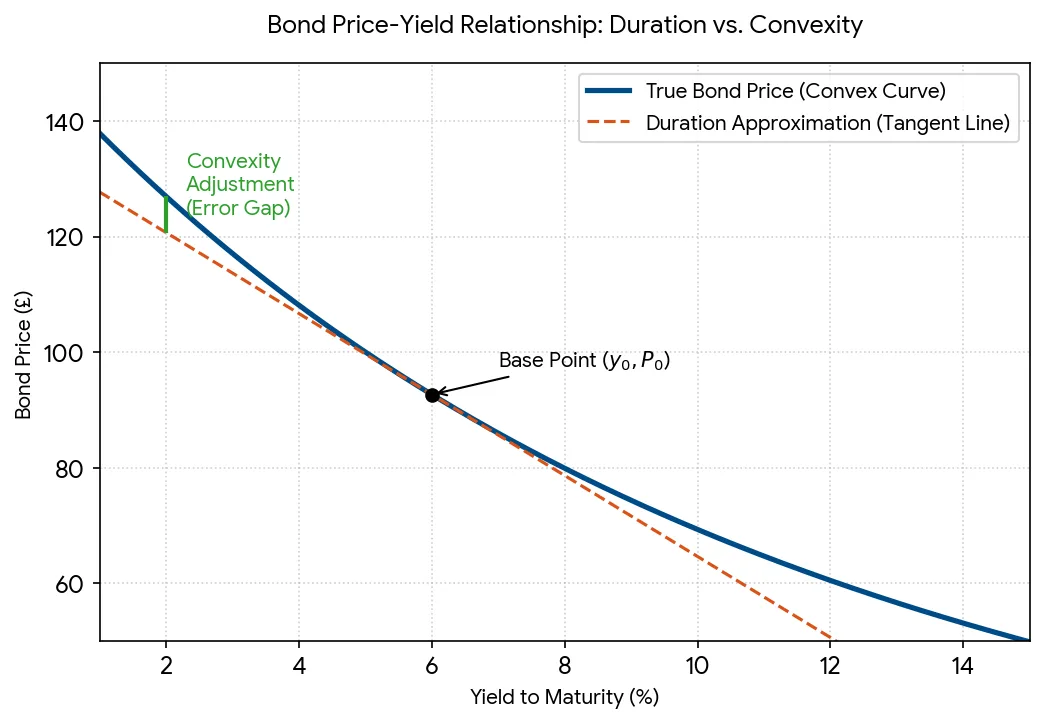
The interest rate the U.S. government pays to borrow, expressed as the return an investor earns holding the bond to maturity. Yields move inversely to prices: when bond prices fall, yields rise, and vice versa. The full curve of yields — from one-month bills to thirty-year bonds — is the economy's base rate structure: mortgages price off it, corporate bonds price as spreads over it, and equity valuations discount through it. When analysts say "the market" expects something, they usually mean a segment of this curve moved. Two yields anchor analysis: the two-year, which tracks expected Federal Reserve policy closely, and the ten-year, which blends policy expectations with growth and inflation over a longer horizon.
Engine one: inflation expectations
The dominant long-run driver. Bond investors lend fixed nominal dollars and are repaid years later; expected inflation over the holding period is a direct subtraction from their real return. When inflation expectations rise, investors demand higher nominal yields to compensate — or sell, which amounts to the same thing — and the curve shifts up, especially at longer maturities where inflation uncertainty compounds. The market's gauge is the breakeven rate: the spread between nominal Treasuries and inflation-protected securities of the same maturity, which quotes the inflation the market prices. The 2021-2022 episode is the era's cleanest demonstration: breakevens surged with inflation prints, and nominal yields followed the repricing upward, with the ten-year roughly doubling over the period, per Treasury data.
Engine two: growth and the data surprise
Bonds price the real economy because the Fed prices the real economy. Strong employment, spending, and output data raise expectations of tighter policy and higher neutral rates; weak data do the reverse. The operative concept for daily moves is the surprise: yields react not to the level of a data release but to its gap from consensus expectations, which is why an excellent jobs report can barely move markets that expected it. The highest-velocity releases are the monthly employment situation, the consumer and producer price indexes, and gross domestic product updates; on these mornings, the ten-year can move ten basis points in minutes. Over longer windows, growth revisions move the whole curve — the 2023 surge toward five percent combined growth revisions with the issuance and term-premium story covered below.
Engine three: the Federal Reserve
The policy rate anchors the short end, and expectations about it ripple outward. The Fed sets the overnight federal funds range; two-year yields essentially track the expected average of that rate over the next couple of years, so every speech, minute, and dot-plot revision reprices the front of the curve. Quantitative policy moves the long end through quantities: the Fed's bond purchases during 2020-2021 compressed yields, and the balance-sheet runoff since 2022 — letting securities roll off without replacement — removed the largest single buyer from the market, contributing to the rise in term premium. The 2022-2026 policy cycle delivered both directions: eleven hikes into 2023, then cuts from late 2024 that brought the funds range to 3.50–3.75 percent by January 2026, per Federal Reserve statements — each step repricing the curve in expected sequence.
Engine four: supply — issuance and the deficit
The borrower sets the quantity, and quantity has a price. Treasury auctions the debt needed to finance the federal deficit — running near two trillion dollars annually in recent years, per Treasury statements — across maturities chosen by the department. When supply of long-dated issuance grows faster than the buyer base's appetite, yields at those maturities rise to clear the market: the late-2023 yield surge accompanied a heavy coupon-issuance calendar, and the Treasury's subsequent tilt toward shorter maturities — documented in its quarterly refunding statements — was an explicit response to long-end strain. Auction results are the observable: weak demand shows up in high yields at the stop and soft bid-to-cover ratios, and a run of soft auctions shifts the whole curve's tone. This engine is slow-moving but cumulative, and it interacts with the ownership structure described below.
Who owns the market, and why does it matter?
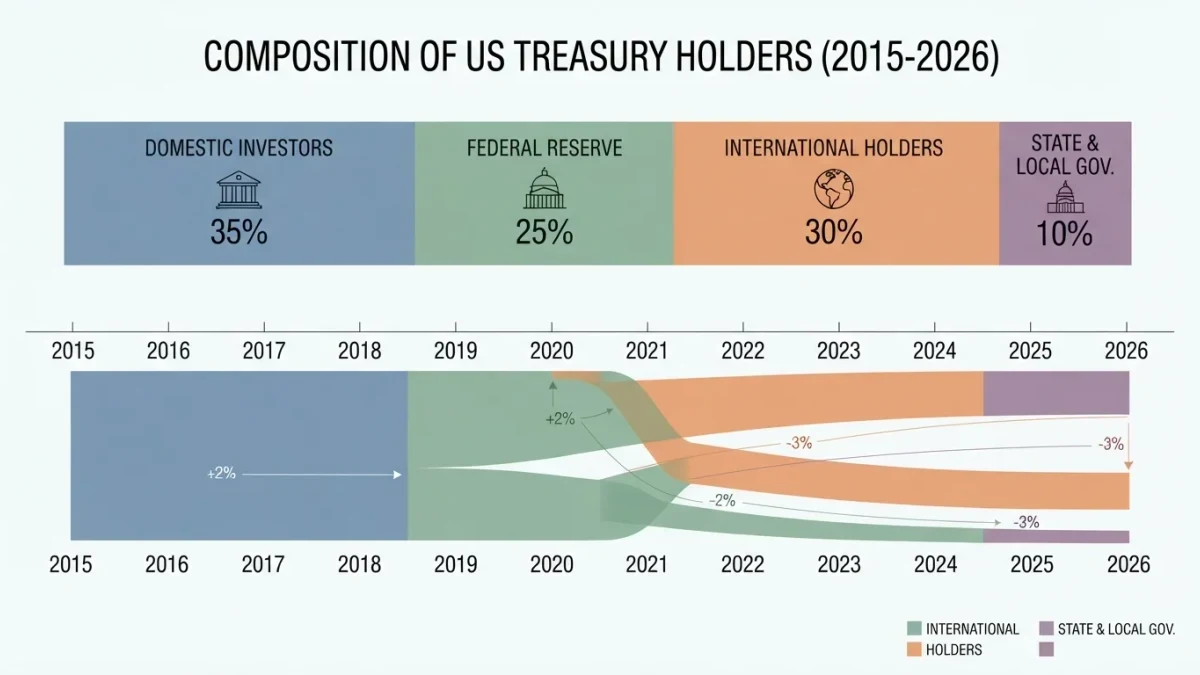
The buyer base has reshaped this decade. Foreign official holders — central banks and governments — plateaued near seven trillion dollars in aggregate for years, per Treasury data, ending the era of reliable price-insensitive accumulation. The Federal Reserve shifted from buyer to net seller under runoff. Into the gap came hedge funds running basis trades, money funds at the short end, households and bond funds at the long end — a coalition of faster, more price-sensitive money, as this publication's analysis of Treasury liquidity detailed. The composition matters for yield behavior: a market owned by traders amplifies moves in both directions, while a market owned by reserve managers dampens them. The 2020s' wider intraday yield ranges are partly an ownership story, not purely a macro one.
How do the four engines combine on a real day?
Consider the anatomy of a typical strong-inflation-print morning. Overnight, futures already price a consensus; the release lands above consensus; two-year yields jump as traders mark up the expected policy path; ten-year yields rise less than twos if the growth implications are modest, flattening the curve; breakevens widen as inflation expectations reprice; and if the auction cycle is heavy that week, dealers shade their bidding — all within the first hour. Each move is attributable, and each attribution is a decomposition of the four engines' relative weights that day. Reading markets this way — as a system with distinguishable drivers — replaces the question "why did yields rise?" with the answerable question "which engine was it, and how do we know?"
What about the plumbing — repo, dealers, and liquidity?
The yield is set in a market with physical constraints. Treasury financing runs through the repo market, where positions are levered and funded; stress in repo transmits to cash Treasuries through forced deleveraging, as September 2019 and March 2020 demonstrated. Dealer balance-sheet capacity — the intermediaries who warehouse inventory around auctions — shapes how smoothly supply absorbs, and the regulatory capital treatment of that capacity is a standing policy debate, covered in this publication's liquidity analysis. None of this changes the four engines' direction; all of it changes the speed and violence with which prices reach their new level. Yield analysis without plumbing analysis is a car analysis without a transmission.
The plumbing also explains a quiet feature of the modern market: the regularity of month- and quarter-end yield moves around index-extension rebalancing, when benchmarked portfolios adjust duration to match expanded indices after new issuance. These calendar flows are small relative to macro drivers but visible in the data — one more reminder that some yield movement is administrative, not economic, and that the decomposition habit protects against narrating administrative noise as conviction.
How should a reader track the engines?
Each engine has a public gauge: breakeven spreads for inflation expectations; the economic-data calendar with consensus estimates for growth surprises; federal funds futures and the Fed's own communications for policy; and the Treasury's quarterly refunding announcements and auction results for supply. Daily curve moves decompose credibly from these five instruments, and a reader who follows them for a quarter will find that most headline explanations were one engine wearing the other three's clothes.
Where can readers get the data?
Treasury publishes the daily par yield curve and auction results on its site; the Fed publishes policy statements, minutes, and balance-sheet data; the economic calendar with consensus estimates is public through statistics agencies. Every number in this explainer traces to those free sources, and the curve itself updates daily — the market's own ongoing answer to the question this article asked.