A dividend yield far above the market average is more often a distress signal than a gift: yields rise when prices fall, and yields above eight or nine percent have historically clustered in sectors facing earnings declines, per long-run dividend records compiled by S&P Dow Jones Indices. The number that looks like income is usually the market's price on a problem. Market Today publishes information, not investment advice, and this analysis is about how to read the arithmetic, not which stocks to own.
Why does a high yield usually mean trouble?
Because yield and price are a seesaw. Divide the annual dividend by a share price that has been cut in half, and the yield doubles without a cent of new income — the stock now offers a ten percent yield because the market doubts the dividend survives. The 2015–2021 energy bust offered a seminar in this: oil producers' yields spiked into the double digits precisely as payout coverage collapsed, and major dividend cuts followed across the sector in 2020, per company filings. The pattern repeats wherever earnings are cyclical: peak yields tend to arrive at trough earnings, which is the worst possible moment for the payout to be affordable.
What is a yield trap, mechanically?
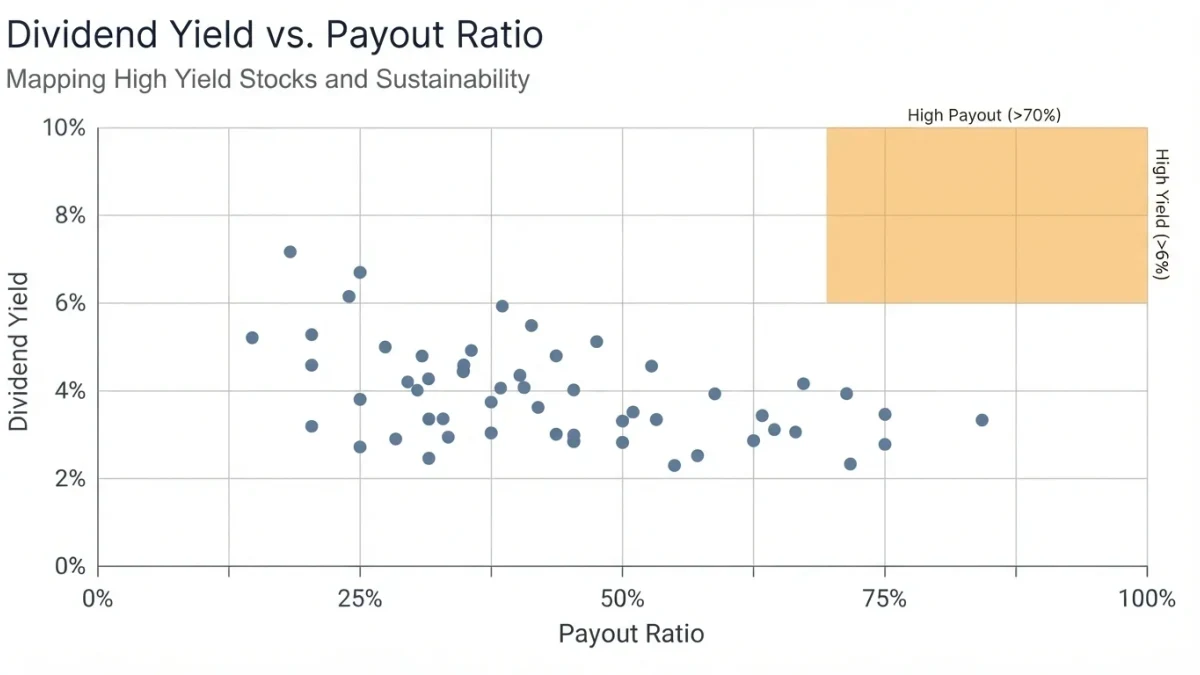
A yield trap is a stock whose high yield embeds a dividend the cash flows cannot fund. Three tests catch most of them. First, the payout ratio: dividends divided by earnings above roughly eighty percent, sustained, leave no buffer for a bad year. Second, the cash flow test: dividends divided by free cash flow above one hundred percent mean the payout is being financed by assets, debt, or luck — the 10-Q's cash flow statement shows it in plain figures. Third, the debt schedule: a generous dividend alongside heavy maturities is a board announcing priorities it will eventually have to reorder. Any one test failing is a question; all three failing is an announcement.
What did the 2020 dividend cuts teach?
That the cuts arrive fastest exactly where yields looked safest the year before. S&P 500 dividends fell in 2020 for the first time since the financial crisis, per S&P Dow Jones Indices data, with the damage concentrated in energy, consumer discretionary, and industrials — sectors where payouts looked plump on 2019 earnings that proved cyclical. Banks and utilities cut or suspended far less. The lesson is not that high yields always fail; it is that the payout's durability depends on the stability of the earnings underneath it, and 2020 ranked every sector on that stability in public.
Can a high yield ever be legitimate?
Yes, and honesty requires the counter-case. Some sectors carry structurally high yields because they are required to distribute most of their cash flow — REITs must pay out at least ninety percent of taxable income to keep their tax status, per IRS rules, and MLPs, business development companies, and shipping companies have similar distribution logic. In those structures a fifteen percent yield can simply reflect a distribution mandate on a slowly growing asset base, not imminent collapse. The tests change rather than disappear: the right questions become whether distributable cash flow covers the payout and whether the asset base is being maintained. A structure-mandated yield still has to clear a cash test.
How should a skeptical reader work through a candidate?
- Compute the yield, then ask what the share price has done over the past year — a doubled yield on a halved price is the trap signature.
- Read the payout ratio on earnings and on free cash flow for the last three years, not one; one bad year is noise, three is a trend.
- Check the balance sheet for maturities in the next twenty-four months against cash on hand.
- Read the last two earnings calls for management language about "preserving flexibility" — a phrase that has preceded many a cut.
- Compare against sector peers: a yield far above every competitor usually means the market sees a company-specific problem.
How do legitimate high yields differ from traps side by side?
The contrast is sharpest in a table: the same headline yield can sit on opposite financial mechanics.
| Feature | Legitimate high yield | Yield trap |
|---|---|---|
| Yield source | Structure mandate (REIT, BDC) | Price collapse |
| Payout vs cash flow | Covered by distributable cash | Exceeds free cash flow |
| Earnings base | Contracted or regulated | Cyclical at peak |
| Debt position | Maturities laddered | Bulk due within two years |
| Management tone | Reaffirms policy | "Preserving flexibility" |
None of the right-hand column is hidden; every cell comes from filings any reader can open.
What is the disciplined verdict?
Yield is information, and the information is usually about risk. A payout backed by diversified, regulated, or contracted cash flows with payout ratios near half of earnings has historically traveled through cycles intact; a payout backed by cyclical earnings at eighty percent of income has historically been a countdown. The dividend that looks too generous usually is, the filings say so in advance, and the investor's edge is nothing more exotic than reading them before the market's doubts become the dividend cut.
Where can readers check these numbers?
Every input above is public: dividend histories and payout ratios sit in filings on EDGAR, free cash flow is a three-line walk through the cash flow statement, and the IRS publishes the REIT distribution requirements. Verification costs nothing but patience, which is cheaper than learning the same lesson from a cut.