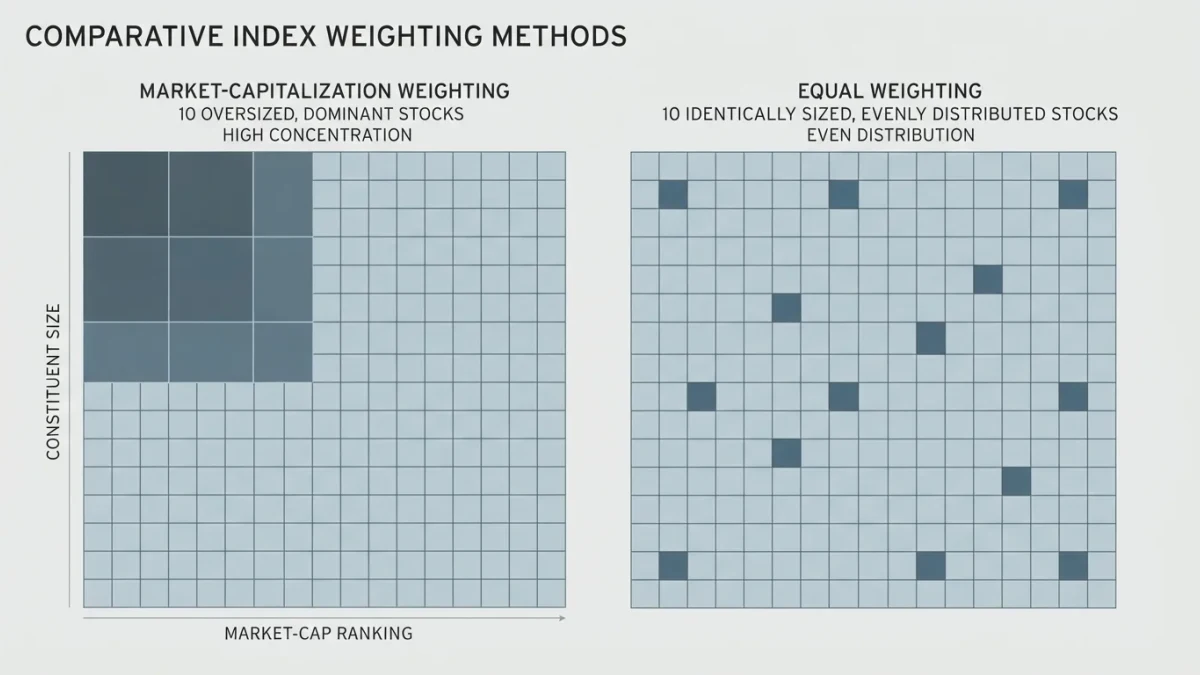

Ten companies accounted for roughly 38 percent of the S&P 500's total market value in late 2025, per S&P Dow Jones Indices index data — the largest share held by ten names since at least the 1970s, and up from about 27 percent at the start of 2024. That single fact reframes what a diversified index fund actually owns.
How concentrated is the S&P 500 right now?
The honest answer: more than at any point in the modern era of index investing. The top ten constituents — dominated by the largest technology and communication-services names — carried approximately 38 percent of index weight in late 2025, per S&P Dow Jones Indices data. One chipmaker alone represented roughly 7 percent of the benchmark. For comparison, the same top-ten share sat near 18 percent in 2015 and peaked around 25 to 27 percent during the dot-com boom in 2000, according to historical S&P index records. The move from a quarter of the index to nearly two-fifths happened within roughly five years.
What does concentration do to a passive portfolio?
It quietly converts an "index" fund into a heavily weighted bet on a handful of firms. A cap-weighted S&P 500 fund allocates its dollars in proportion to market value, so the largest constituents automatically receive the largest share of every new dollar. When the top ten approach 40 percent of weight, a fund marketed as exposure to 500 companies behaves, in risk terms, far more like a concentrated portfolio: a 20 percent drawdown in ten names would subtract roughly eight percentage points from the whole index, holding other stocks flat. The arithmetic is mechanical, not a forecast.
The same arithmetic compounds across a portfolio that looks diversified on paper. An investor holding an S&P 500 fund, a Nasdaq-100 fund, and a large-cap growth fund owns the same ten balance sheets three times over, because the giants dominate all three products. Multi-fund ownership widens the label on the wrapper, not the underlying exposure, and the overlap is visible in any fund fact sheet that lists top holdings side by side.
Doesn't concentration simply reflect genuine earnings power?
This is the strongest counter-argument, and the filings give it real support. The mega-caps that dominate the index generate enormous revenue, high gross margins, and substantial free cash flow, and their 10-K filings disclose segment economics that many mid-cap companies cannot match. Weight follows market value, and market value has followed reported results. The 2000 episode differed on this exact dimension: many of that era's largest index members had thin or negative earnings, while today's leaders report tens of billions in quarterly profit. Concentration backed by cash flow is not the same animal as concentration backed by narrative.
What did previous concentration peaks teach?
The record offers a caution, not a rule. After the 2000 peak, the largest technology names underperformed the broad market for years, and the top-ten share of the index fell by roughly half over the subsequent decade, per historical S&P data. An investor who held only the ten largest stocks of early 2000 spent years waiting for breakeven, while the equal-weighted universe recovered faster. The lesson the data actually supports is narrower than "concentration crashes": it is that at high concentration, index returns and a narrow set of fundamentals become tightly coupled, for better and for worse.
What does an equal-weight comparison show?
It shows how much of the index's return has been a top-heavy story. Through 2023 and 2024 and into 2025, the cap-weighted S&P 500 outpaced its equal-weighted counterpart by wide margins in the years the mega-caps led, and the gap narrowed in stretches when breadth improved — a pattern visible in the published performance of both S&P indices. That divergence is the cleanest single measure of how much index performance depends on the largest ten names. It is a description of the past, not a prediction of the next decade.
What does concentration do to active managers?
It narrows their room to maneuver. A manager benchmarked against the S&P 500 who holds none of the ten largest constituents starts every year with roughly 38 percent of the benchmark working against any position that differs, per the same index data. The practical consequence, documented in successive annual scorecards of active large-cap funds, is that many professionals now hug the benchmark closely, holding the giants at near-index weight to control career risk. Concentration therefore does not merely reshape passive portfolios; it quietly reshapes the entire ecosystem that prices large-cap American equities.
What is the honest verdict?
Concentration is a structural fact with two genuine sides, and the data does not let either camp claim victory. Bulls can point to earnings that justify weight; skeptics can point to 2000 and to the mechanical coupling of passive portfolios with ten balance sheets. What the evidence does establish: at roughly 38 percent top-ten weight, stock-specific risk in a handful of companies now transmits directly into the core of most retirement portfolios, and anyone using the S&P 500 as a proxy for "the market" should say aloud what that market has become.
Where can readers verify the underlying filings?
The primary documents are public. Annual reports on Form 10-K for every index constituent are available through the SEC's EDGAR system, and S&P Dow Jones Indices publishes index weights and factsheets on its own site. Verification beats any columnist's summary, this one included.