
Freight rates are one of the earliest public signals of supply chain stress in commodity markets. When shipping costs for a route jump, the pressure usually shows up in vessel supply, port congestion, or rerouted trade flows weeks before it reaches the headline price of the crude, grain, or metal being carried. The qualification matters: freight is a signal, not a prophecy, and it can rise for reasons that never touch the underlying commodity.
The mechanism is straightforward. Most bulk commodity trades are priced as the cost of goods at the loading port plus the cost of carriage. When carriage costs move, delivered prices move with them, even if the commodity itself has not changed hands at a different value. According to SeaRates, a $10 per metric ton rise in freight on a $250 per metric ton grain cargo lifts delivery costs by roughly 4 percent, with no change in the base commodity price.
This piece explains how the signal forms, how it transmits into crude, metals, and agricultural markets, and where reading it too literally leads investors and traders astray. Shipping is not a side note to commodity pricing. It is part of the pricing system itself.
Why do freight rates move before commodity prices?
Freight markets react faster and harder than the goods markets they serve, because vessel supply cannot adjust quickly. Ships take years to build and enter service. When cargo demand rises suddenly, the available tonnage tightens within days and rates spike; when demand falls, the same rigidity produces sharp declines. AXSMarine describes this as freight markets amplifying economic cycles rather than mirroring them.
That asymmetry is what gives freight its early-warning quality. A trader watching grain flows knows that a surge of bookings from one export region will compete for the same limited vessels. The rate moves first. The physical cargo, and any effect on regional grain prices, arrives later. We covered a connected angle in How Does One USDA Report Set Grain Prices Around the World?.
Distance amplifies the effect. Freight demand is measured in ton-miles, which combine cargo volume with voyage length. If trade shifts onto longer routes, demand rises even when volumes stay flat, because each voyage ties up a ship for more time. Rerouting events, whether driven by conflict, sanctions, or export policy, can therefore move rates out of proportion to any change in how much commodity is actually being shipped.
How does shipping cost cascade into crude, metals, and crops?
The transmission runs through contract structure. Because most commodity transactions are priced on a free-on-board basis plus freight, higher transport costs flow directly into the delivered, or CIF, price. SeaRates traces the chain as trade surge, then corridor congestion, then freight rate increase, then CIF adjustment, then regional price divergence. Logistics does not set the commodity price, but it shapes how that price adjusts region by region.
Each commodity family feels it differently:
- Crude and energy products. Tanker demand tracks import demand in major buying regions. When energy flows reroute, longer voyages absorb vessel capacity and lift rates, which then feed into delivered crude costs.
- Metals and dry bulk. Construction and industrial cycles drive iron ore, coal, and bauxite flows. A manufacturing upturn raises raw material imports first, tightening bulk vessel supply before finished-goods trade follows.
- Agricultural crops. Harvest cycles create seasonal surges. Grain and soy cargoes concentrate into narrow export windows, and competition for tonnage in those windows pushes rates up sharply even in a normal year.
The result is regional, not uniform. SeaRates' February 2026 corridor snapshot shows the spread clearly: grain movement from the Black Sea to the Mediterranean priced from $880, soy and grain from the US Gulf to Asia from $2,000, and soy from Brazil to China from $28, with each corridor carrying a different market signal. Pressure builds where the flows concentrate, and secondary corridors stay calmer.
What did the rice episode show about bottleneck transmission?
The clearest recent illustration involves rice. According to SeaRates' analysis of 2026 commodity logistics, global rice prices rose 11 percent in mid-February 2026. The cause was not a shortfall in production. It was a combination of export policy changes, rising import demand, and intense contracting that pushed trade volumes into specific export corridors.
Those corridors hit operational limits. Backup capacity could not absorb the sudden demand, congestion built, freight rates rose, and delivery times lengthened. Delivered costs adjusted upward even where the base commodity price had not moved. Traders responded by redirecting flows, paying premiums for faster delivery, and watching regional spreads widen.
The lesson generalizes. Bottlenecks form at identifiable layers: inland rail and trucking during seasonal peaks, port terminal slots and loading windows, alternative corridors after flows are redirected, and infrastructure that lacks the elasticity to absorb surges. Once pressure builds at one layer, SeaRates notes, pricing responds across the whole chain. A freight signal that appears at the port layer often traces back to a rail or inland constraint that commodity price charts never show.
What do freight indices actually measure, and what do they miss?
Indices such as the Baltic Dry Index aggregate spot rates for hauling dry bulk cargoes like coal, iron ore, and grain. Because those cargoes are raw inputs to industrial activity, the index is widely read as a gauge of where global trade is heading, not just what ships cost. Commodities Hub makes the point that these indices serve as broader economic indicators, offering signals about trade volumes, growth, and contraction.
What they miss is just as important for a careful reader:
- Segment specificity. Dry bulk, tankers, and container shipping are separate markets. A rally in one says little about the others.
- Route concentration. Global averages can hide regional spikes. AXSMarine notes that imbalanced trade forces vessels to reposition empty, and that the resulting inefficiency shows up as regional rate spikes not immediately visible in global numbers.
- Anticipation versus realization. Markets position ahead of expected seasonal demand, so rates can move before cargo flows materialize. An early rate rise may price in demand that never arrives.
- Structural change. Slower steaming for fuel efficiency and emissions rules, port congestion, and fleet renewal all shift costs and transit times for reasons unrelated to commodity demand.
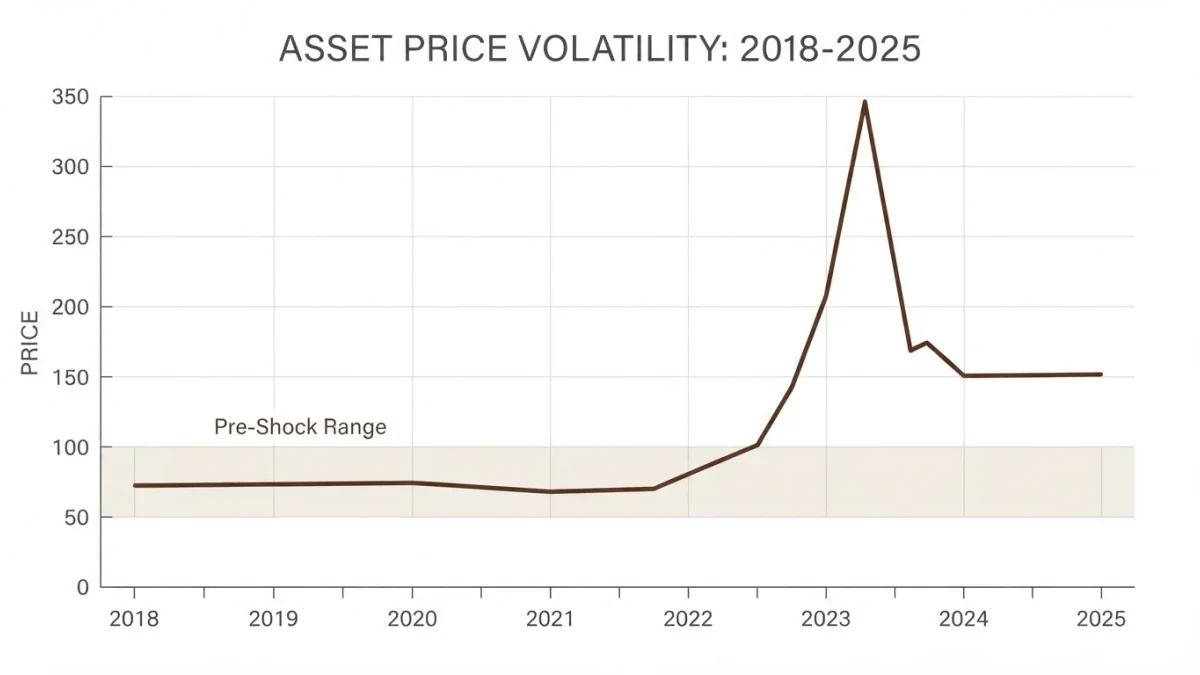
Container freight illustrates the amplification risk. Commodities Hub recounts that the Shanghai Containerized Freight Index peaked in January 2022 at roughly five times its pre-COVID level, driven by port congestion, a demand surge as economies reopened, and an industry unable to add capacity quickly. That was a logistics event as much as a trade event, and reading it purely as a demand signal would have been a mistake.
What this means for reading the signal
Our analysis of the supplied evidence suggests a disciplined approach rests on three habits. First, always ask which corridor and which vessel class produced the rate move. A Black Sea grain rate and a US Gulf to Asia rate can tell opposite stories in the same month, as the February 2026 snapshot shows. Second, separate logistics-driven price changes from commodity-driven ones. The rice episode moved delivered prices 11 percent with no production shortfall, which is a very different event from a genuine supply shock.
Third, treat freight as one input among several, alongside inventory reports and production data. Readers following crude, for example, will find that storage and supply data carry the primary signal, with freight adding context on delivery economics; our coverage of How Does the EIA's Weekly Oil Report Move Crude Prices So Much? covers that channel. For grains, the USDA reporting cycle remains the anchor event, as explained in How Does One USDA Report Set Grain Prices Around the World? For related coverage, see How Does the EIA's Weekly Oil Report Move Crude Prices So Much?.
The honest hedge is this: freight rates lead sometimes, lag sometimes, and mislead when structural shipping factors dominate. On the evidence supplied, they are best read as a real-time measure of friction in the trade system. Friction usually precedes price adjustment. It does not always cause it.
Where does the freight signal end and the commodity story begin?
The boundary sits at the delivered price. Freight determines what a buyer pays to have a commodity arrive, and through regional spreads it determines which origin wins a sale. Brazil-to-China soy at $28 per ton versus US Gulf-to-Asia soy at $2,000 per ton is not a footnote; it is a competitive fact that decides which exporter sells the next cargo. Commodity readers who want the fuller picture of how these markets hang together can start with the publication's commodities coverage.
What the evidence establishes is that maritime shipping carries the overwhelming majority of world trade by volume, that its costs transmit directly into delivered commodity prices, and that corridor-level stress shows up in rates before it shows up in regional commodity quotes. What remains unknown in any given episode is the durability of the move: whether a rate spike reflects a lasting shift in trade patterns or a temporary congestion that will clear. Distinguishing the two requires the very inventory, production, and policy data that freight indices alone cannot supply.