Around the tenth of each month at noon Eastern, the U.S. Department of Agriculture releases the World Agricultural Supply and Demand Estimates — WASDE — and corn, soybean, and wheat futures on the Chicago board can gap the legal daily limit on a single revision to projected ending stocks. A government spreadsheet moves world grain prices.
What does WASDE actually estimate?
Supply, use, and carryout for major crops, for the United States and the world. For each commodity — corn, soybeans, wheat, rice, cotton, and the oilseed complex — the report's balance sheet walks through planted area, yields, production, imports, domestic consumption split into feed, food, and fuel uses, exports, and finally ending stocks: what remains in the bin when the marketing year closes. That ending-stocks number, usually expressed relative to total use as the stocks-to-use ratio, is the figure traders actually price, because it measures abundance or scarcity after all demand is satisfied. Small projected stocks mean the market must ration demand by paying more; large stocks mean slack. The report also carries domestic and world price projections and, seasonally, U.S. winter wheat and South American crop estimates.
Why is a U.S. government report the world benchmark?
Because the United States is the world's largest grain exporter and its statistics are trusted as neutral. American corn and soybean exports anchor world trade flows, and futures contracts on the Chicago Mercantile Exchange — corn, soybeans, wheat — are the global reference prices that physical cargoes everywhere price against. When a South American soybean cargo sells to China, the contract benchmarks off Chicago. Producers, importers, and food companies worldwide therefore hedge in Chicago, and Chicago prices off WASDE: a U.S. report becomes the world's report by market structure rather than decree. Other exporters publish estimates too — Brazil's CONAB is the notable one — but USDA's methodology, long history since the report's 1973 origin in that decade's grain crisis, and monthly cadence keep it the reference of record.
How are the numbers assembled — and why the locked room?
By an interagency committee under seal. The World Agricultural Outlook Board, a coordinating body, convenes analysts from USDA's statistics service, economic research service, foreign agricultural service, and farm agency, who reconcile survey data, satellite-derived crop conditions, weather models, and attaché reports from abroad into one set of estimates. On release mornings, journalists and data vendors historically sit in a lockup room — communications sealed, phones surrendered — so everyone receives the report simultaneously at noon, a protocol designed when milliseconds mattered less but retained because a report this market-moving cannot leak. The lockup is a physical expression of the report's status: official statistics as market infrastructure.
Which reports matter most within the year?
The crop's own calendar sets the intensity. Every March, the Prospective Plantings report surveys farmers' sowing intentions, giving the first real shape of the next U.S. crop — and the WASDE that follows incorporates it. June's acreage update revises those intentions from what farmers actually planted; August through November, the critical period, walks field surveys through the growing season, with the September and October reports historically carrying the sharpest revisions as actual ear and pod counts replace assumptions. January brings final production numbers. For world balance, South American growing seasons mean January-through-March WASDEs carry heavy Brazilian and Argentine soybean and corn revisions — and in an era when Brazil rivals or exceeds U.S. soybean output, those rows of the spreadsheet move Chicago as hard as the domestic ones.
How dramatically can a WASDE move prices?
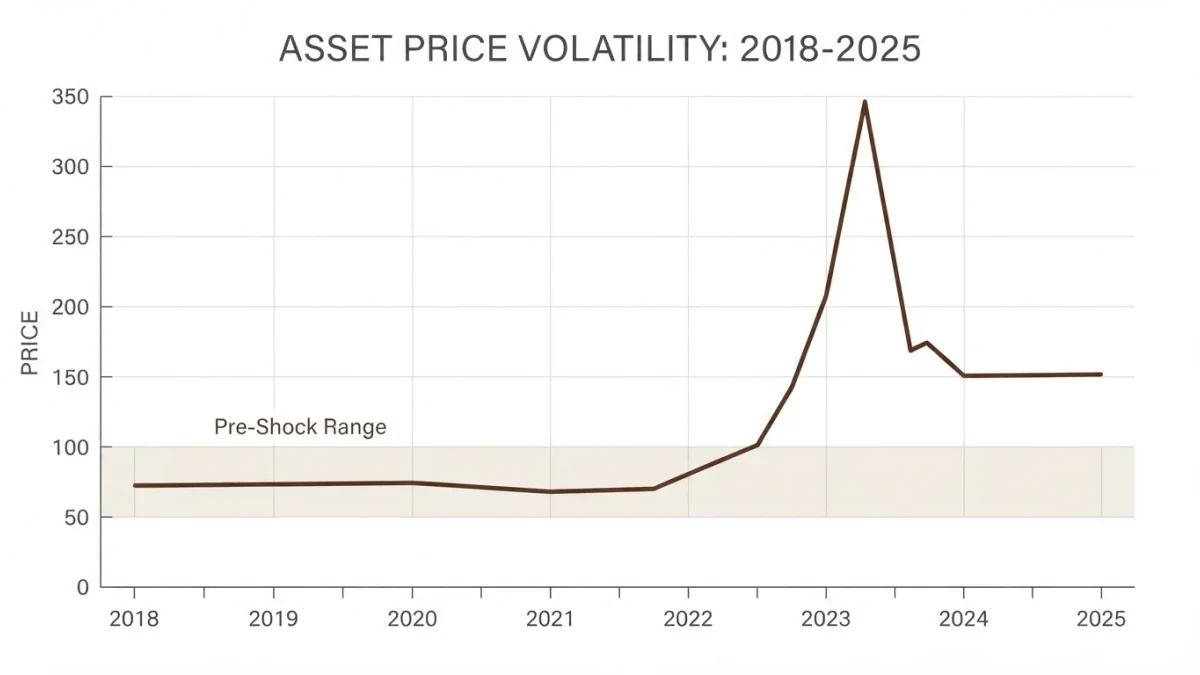
The historical record offers clean exhibits. In the 2012 U.S. drought, successive WASDEs cut projected corn yields through the summer until ending stocks ran near pipeline minimums and corn futures reached record levels above eight dollars a bushel, per exchange data — rationing demand, exactly as the framework predicts, as feedlots shifted rations and ethanol margins compressed. Conversely, the record-large 2016-2017 global harvests fattened ending-stocks projections and held grain in multi-year price sloughs. Trade policy episodes cut both ways: during the 2018–2019 U.S.-China trade dispute, WASDE's shifting U.S. export projections tracked Chinese buying pauses in real time, per report archives. The pattern across all episodes: prices move on the surprise — the gap between the new estimate and the analyst consensus — with limit moves occurring when the surprise lands on a tight balance sheet.
Where do yields and weather enter the estimates?
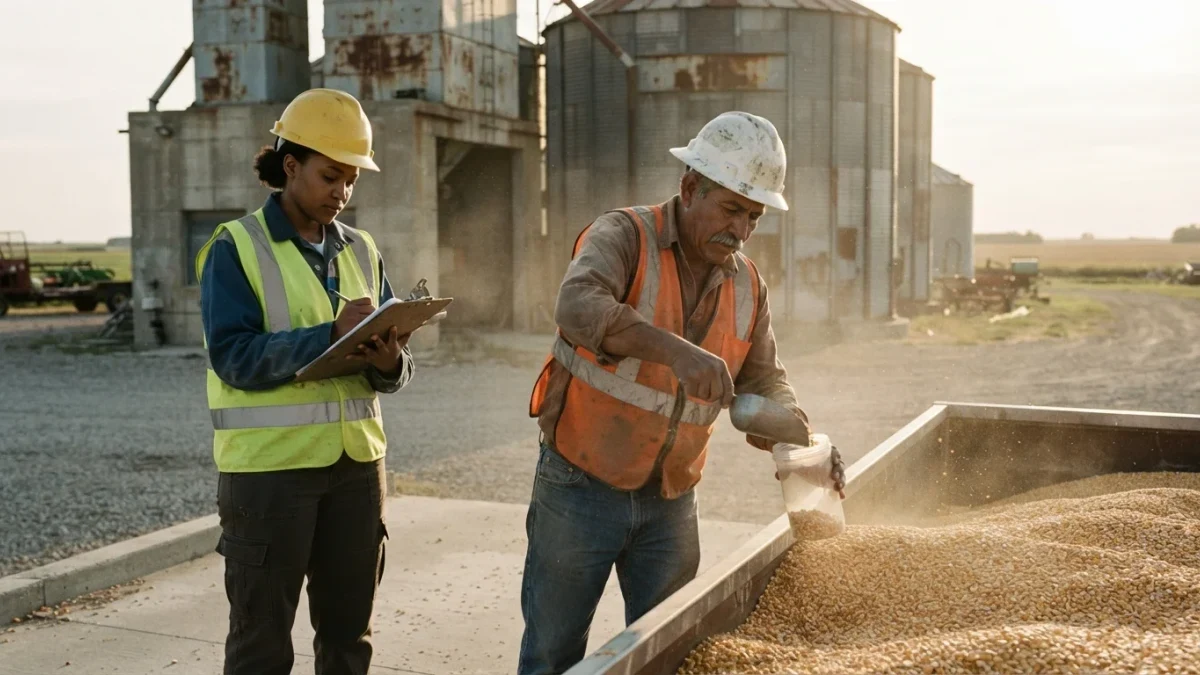
Through a mix of field counts and models that USDA documents openly. During the growing season, the statistics service's field surveys — actual field measurements, ear and pod counts — and farmer yield surveys drive the domestic numbers, while satellite vegetation indices and weather service data inform condition assessments. International estimates lean on attaché reports, foreign government data, and meteorological models. This is why the trade watches weekly crop-condition ratings and proprietary yield models: they are forecasting the forecast, building consensus estimates of what WASDE will print, and the market reacts to deviations from that consensus. A WASDE surprise is usually not new weather — the weather was public — but a new official interpretation of what the weather did to the balance sheet.
What do the balance sheets mean for food prices?
Less and more than headlines imply. Grain is a component of food costs — farm-level corn is a fraction of the price of cereal, meat, and sweeteners after processing, transport, and retail margins — so even large WASDE shocks pass through to grocery prices damped. But direction matters, and sustained tightness compounds: the 2010-2012 period's successive shortfalls contributed to global food-price indices at record levels, per United Nations food price data, with documented consequences in import-dependent countries. Corn's dual role as feed and fuel tightens the coupling: roughly forty percent of the U.S. corn crop feeds ethanol plants under the Renewable Fuel Standard, meaning energy policy sits inside the grain balance sheet, and a WASDE that cuts corn availability immediately reprices the competition among fuel, feed, and export buyers.
How does WASDE interact with private forecasts and trade positioning?
The report lands into a market that has already priced an expectation. Private analytics firms — commodity consultancies and satellite-imagery services — publish acreage and yield models ahead of each report, and data vendors survey analysts to publish consensus estimates for the key numbers. Positioning data from the exchange regulator shows how stretched speculators are before the print. The release then resolves a three-way comparison: the report versus consensus, positioning versus the surprise, and the balance sheet's starting tightness. A bullish surprise into a market already crowded with bullish bets can produce the counterintuitive result — prices falling as winners take profits — which is why veterans say the report's number is only half the trade; the positioning around it is the other half.
How should a skeptical reader use WASDE?
As a monthly anchor with known error bars. The estimates revise — sometimes sharply, always openly, with the history preserved — and a disciplined reader tracks the revision pattern rather than any single print: three consecutive cuts to a foreign crop estimate say more than any one of them. Compare the ending-stocks trajectory against the five-year averages, read the stocks-to-use ratio rather than the raw number, and treat the trade's pre-report consensus, published by data vendors, as the true benchmark the market will score. And respect the calendar: a WASDE two weeks before a critical weather window is a placeholder; the same report after the window is a verdict.
Where can readers get the report themselves?
USDA publishes WASDE free on release day through its economics agencies, with full archive, methodology, and the accompanying crop production reports. Reading the tables directly — balance sheet by balance sheet — for a year teaches the mechanics of world grain trade as no commentary can, and the price of admission is an internet connection.
A year of reading also teaches the report's rhythm: estimate, revise, finalize — with the final January production numbers closing each season's ledger. Readers who follow that rhythm stop treating any single WASDE as prophecy and start treating it as the most authoritative monthly chapter of an ongoing story, which is exactly its designed role.