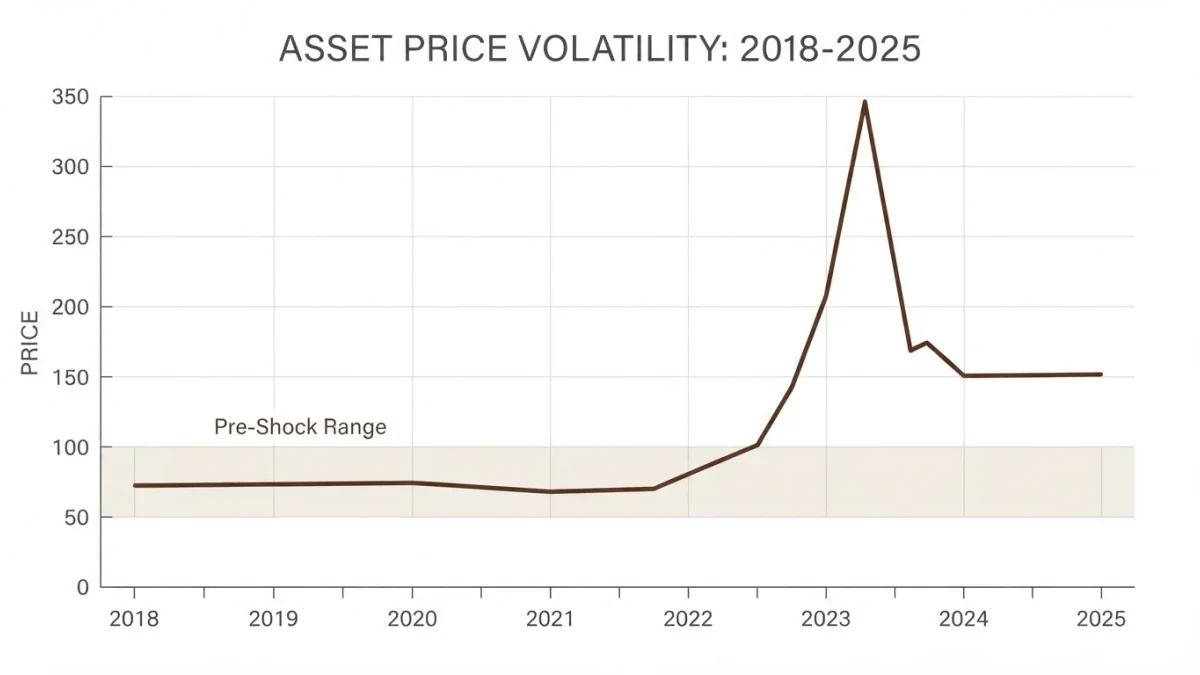
Battery-grade lithium carbonate in China rose from roughly ten thousand dollars a ton in 2020 to a peak near eighty thousand in late 2022, then collapsed over the following two years to under ten thousand — roughly ninety percent below the peak — before tariff-era distortions and capacity discipline began carving a bottom in 2025, per Asian spot price assessments. One full commodity cycle — boom, response, bust — executed in under five years.
Why did lithium boom so hard in 2021 and 2022?
Policy-created demand met a supply base built for a smaller market. Electric-vehicle mandates and subsidies across China, Europe, and North America turned battery demand from a niche into the marginal driver of a small market: lithium's demand base was tiny relative to copper or oil, so percentage shifts in battery output translated into violent shifts in lithium's balance. Supply could not keep pace — mine development runs years, and the 2018-2020 price trough had idled projects — while China's spot market, the world's pricing hub, ran on thin inventories. Prices rose roughly eight-fold from 2020 levels into the late-2022 peak, per spot assessments, and the annual contract prices long favored by Western producers were abandoned mid-boom for index-linked deals, a structural surrender that told the market the squeeze was real.
Why was the supply response so fast?
Because lithium's supply curve had a short segment: Chinese lepidolite and African spodumene. Unlike copper, whose decade clock was described earlier in this series, a meaningful tranche of lithium supply scales in two to three years — hard-rock mines in China's Jiangxi province, artisanal-adjacent operations in Zimbabwe and Nigeria, and expansions at established Australian pits. The 2022 price spike financed exactly that: Australian mines expanded, African feedstock flooded Chinese converters, and Chinese chemical capacity — the refining step that dominates the supply chain, with China processing the majority of world lithium chemicals — grew even faster than mines. By 2024 the market was in visible surplus, and the price did what prices do in surplus: it fell below the incentive price of marginal supply, which is the cycle's self-correction mechanism operating by design.
What does the bust look like in the data?
A staircase down with pauses at each cost tier. Spot carbonate broke below sixty thousand dollars in 2023, then thirty, then in 2024 through the teens into single digits by late 2024-2025, per assessment data. At each level, a band of high-cost supply — Chinese lepidolite first, then higher-cost African conversion — became uneconomic and curtailed, producing the pauses; each time demand growth caught up partially, and then surplus inventories pushed the price to the next tier. Producers' quarterly reports marked the same story in financial form: Australian spodumene producers shifted from record margins to care-and-maintenance decisions, and several development-stage projects deferred final investment. The 2025 bottoming attempt combined those curtailments with a new variable: tariffs.
What did 2025's tariffs do to the market?
They split one price into several. The U.S. tariff regime that escalated through 2025 placed batteries, critical minerals, and Chinese goods at the center — with Chinese lithium chemicals facing steep U.S. tariffs and critical-mineral sourcing rules pushing automakers toward non-Chinese supply chains, per official tariff schedules and agency rules. The result was a bifurcated market: ex-China project developers and Western refiners commanded policy-premium pricing for tariff-compliant material, while Chinese spot — the world's reference — stayed depressed by surplus. The lithium market now carries a political geography that didn't exist in the 2021 boom, and any analysis that quotes a single lithium price without specifying which continent's price is describing a market that no longer has one.
Why is China the center of the lithium world?
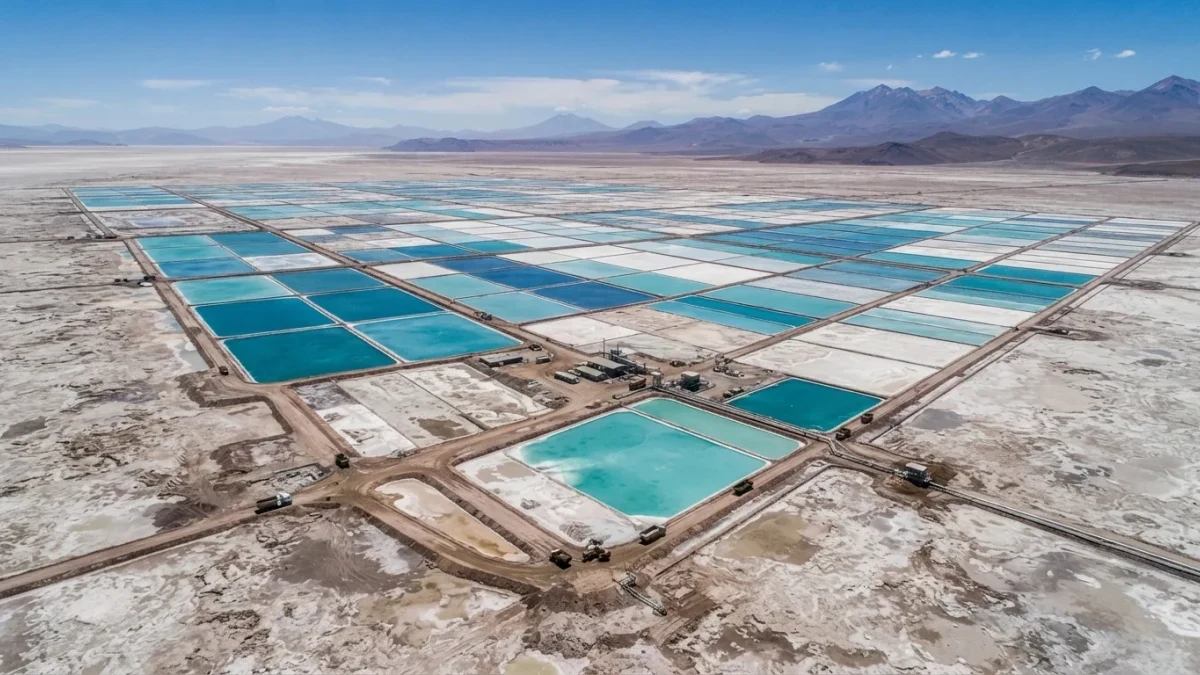
Refining share, not resource share. Lithium resources spread widely — Australia mines the largest share of hard-rock feed, while the richest brine resources sit in Chile, Argentina, and Bolivia's salt flats — but China converts the majority of the world's lithium chemicals, builds most cathode capacity, and assembles the majority of batteries, per benchmark mineral-agency data. The 2022-2024 bust strengthened the position: cheap spot prices bankrupted high-cost Western hopefuls while integrated Chinese converters absorbed feed from their own and African mines. Western industrial policy — the U.S. Inflation Reduction Act's sourcing rules, the European battery push — is explicitly an attempt to build an ex-China chain, and the 2025 tariffs hardened that separation. Whether those chains reach competitive cost is a live question the price crash complicated: building ex-China capacity against a depressed Chinese reference price is the bust's cruelest arithmetic.
How does lithium demand actually break down?
Batteries dominate, and batteries split by end market with different cycles. Electric vehicles take roughly two-thirds or more of lithium demand growth on most public accounting, split between China's mass market — the world's largest, and increasingly export-oriented — and Western premium segments whose growth rates have disappointed 2021-era projections. Stationary storage is the swing buyer: grid batteries scale fast precisely when they are cheap, meaning storage demand accelerates in busts and stabilizes the price floor — a structural stabilizer the 2018 bust lacked. The remainder — ceramics, greases, pharmaceuticals — is steady and price-inelastic, too small to move the balance but large enough to set an absolute floor under a collapsed price.
What are the investment lessons with evidence behind them?
Four, generalizable well beyond lithium. First, small-demand commodities with policy-driven growth produce the most violent cycles: the demand base was too small to absorb the ramp smoothly. Second, supply elasticity determines cycle length: lithium's two-to-three-year supply segment made this cycle a sprint; copper's decade clock makes its cycle a marathon. Third, the incentive price is the real floor: prices fell until marginal supply shut, exactly as theory orders — but identifying which supply is marginal requires cost curves, not sentiment. Fourth, structural narratives — "this time batteries change everything" — are most persuasive at price peaks and least persuasive at troughs, when they are arguably most true. The disciplined response to each is the same: cost curves, capacity data, and skepticism toward narratives priced at either extreme.
Where does the cycle stand now, honestly?
Bottoming, with genuine uncertainty about the slope. Curtailed capacity, depleted inventories, and still-growing battery demand point toward balance in the second half of the 2020s on most forecasters' arithmetic — estimates, as always, labeled as such — while potential new supply from Africa and Argentina keeps the ceiling contested. The tariff split muddies even that reading: the West may need to build capacity the Chinese reference price says is uneconomic, which is not a market outcome but a policy choice, priced as such in project financings. What the evidence supports is narrower than any forecast: lithium has completed a full cycle, taught its lessons in public data, and settled into a regime where location and policy, not geology alone, set the price.
How should readers track lithium without subscriptions?
A workable stack exists free: the U.S. Geological Survey's mineral summaries for production and resources; benchmark agencies' public commentary and price-history press releases for the price narrative; listed producers' quarterly reports for cost curves and curtailment decisions; and government policy documents — tariff schedules, sourcing rules — for the political geography. The full series reconstructs the cycle and its present state credibly, which is the standard this series holds for every commodity it covers.
A closing caution on price data itself: lithium remains an assessed market — no exchange-settled benchmark with the audit trail of oil or copper — so different assessors quote different series, and large gaps between them are information about liquidity, not arbitrage. Readers comparing prices across sources should first confirm they are quoting the same product, purity, and continent; in lithium, those three qualifiers carry most of the analysis.