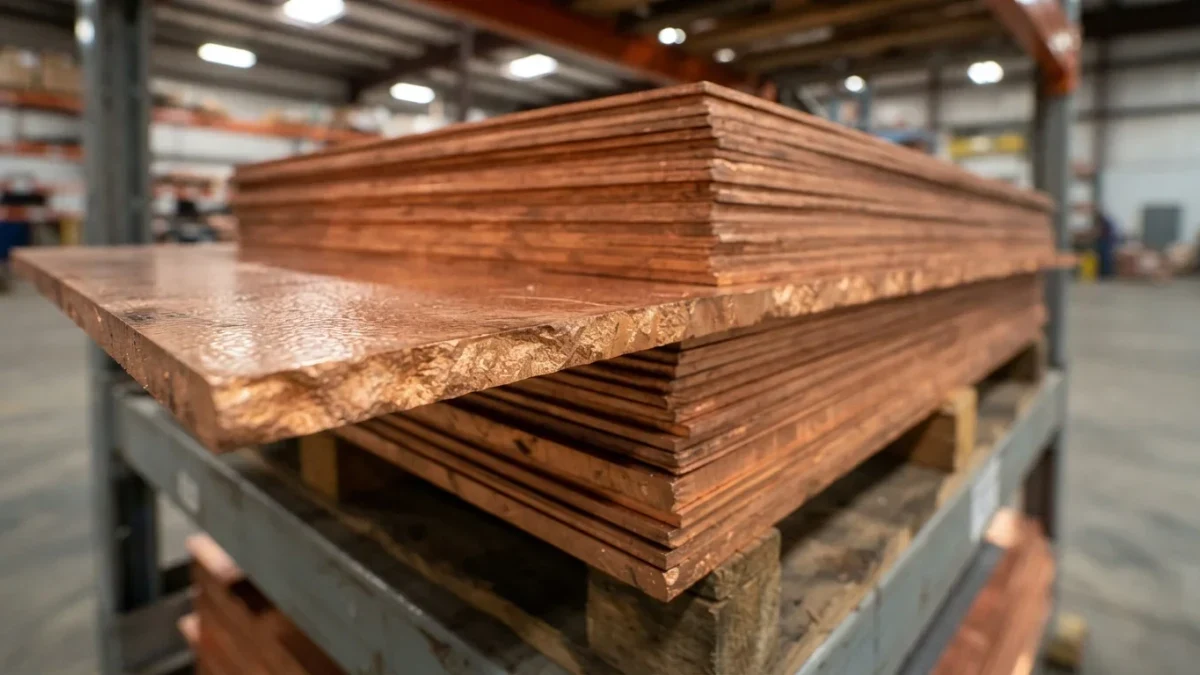
The world's copper mines produced roughly 22 million metric tons in recent years, per U.S. Geological Survey statistics, while forecasts of transition-driven demand growth — electric vehicles, grids, wind and solar — consistently point to needing several additional million tons annually by the mid-2030s, a gap research houses project in the range of ten percent or more of expected supply (estimates vary by scenario). The metal of electrification faces a supply curve measured in decades against a demand curve measured in policy deadlines.
Why does electrification need so much copper?
Because copper is how electricity moves. The metal's conductivity, ductility, and corrosion resistance make it the default for every wire, busbar, motor winding, and grid connection, and the transition replaces fuel systems — which carry energy in tanks and pipelines — with electrical ones that carry it in copper. An electric vehicle contains roughly three to four times the copper of a conventional car, on the order of sixty-plus kilograms versus the low twenties. Wind turbines use several tons per megawatt, more offshore than on. Solar farms, battery storage, charging networks, and grid expansion pile further loads on the same input. Electric machines are not gasoline machines with a different fuel tank; they are rewired machines, and the wire is copper.
Where does copper supply actually come from?
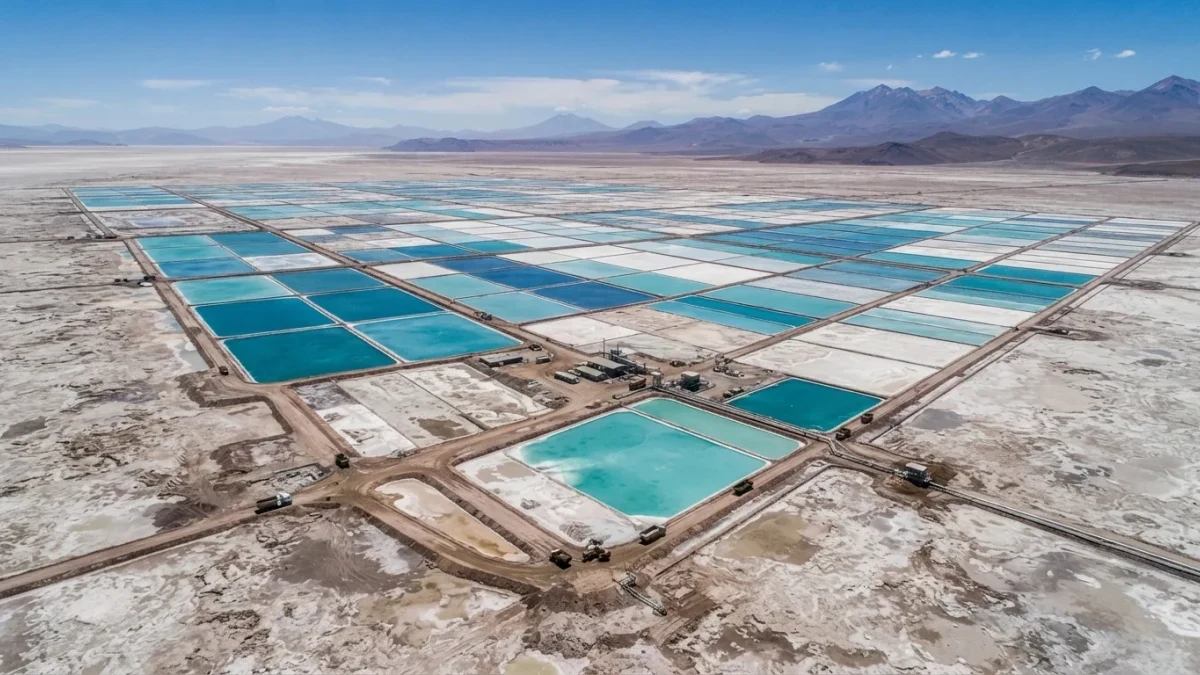
A concentrated mine map plus a large recycling stream. Chile alone produces nearly a quarter of world mine output, with Peru, the Democratic Republic of the Congo, China, Indonesia, and the United States the other major producers, per USGS country data — and the DRC's growth has been the single largest supply story of the past decade. Refined metal comes from two routes: mining concentrates smelted and refined, and scrap reprocessed directly; recycled material supplies roughly a third of global refined consumption, which softens mine pressure but cannot expand indefinitely, since scrap availability depends on past production. Ore grades have declined for decades: the average Chilean head grade has fallen as giant aging pits deepen, meaning more rock moved per ton of metal.
Why can't supply just respond to price?
Because of the industry's clock. A major copper mine takes ten to twenty years from discovery to first production — exploration, drilling, feasibility studies, permits, financing, construction — and several of the 2020s' biggest supply stories are cautionary tales on that clock. The Cobre Panamá mine in Panama, one of the world's larger sources at roughly one-and-a-half percent of global supply, halted in late 2023 after a court ruling on its concession, removing hundreds of thousands of tons annually. Chile's state producer Codelco, steward of the world's largest reserves, has struggled with declining ore grades and accidents — a 2025 incident at its El Teniente mine cut output guidance further, per company reports. New projects announced in response to today's prices deliver metal in the 2030s; demand policy lands this decade. That mismatch is the entire story.
What did the 2024–2025 price action show?
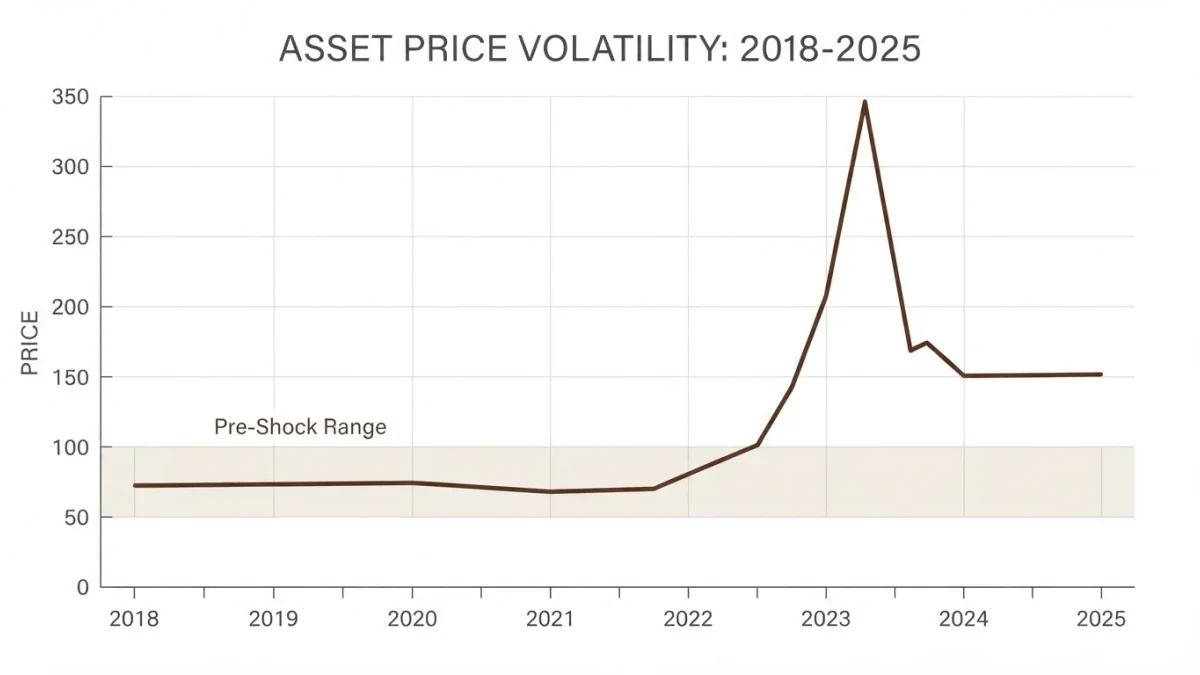
How a tight fundamental story meets trade policy. Copper prices pushed to record territory above eleven thousand dollars a ton in 2024 amid speculative anticipation of transition demand, and a U.S. futures squeeze that spring briefly blew out the American premium over London prices. Then 2025 brought the tariff era: a U.S. Section 232 investigation culminating in a fifty percent tariff on imported copper announced in July 2025, per the White House proclamation — after which the U.S. futures premium over London spiked by double-digit percentage levels as American buyers front-run imports and global supply rerouted. The episode is a case study in how one physical market can price in two currencies of scarcity: the global balance, and the politically drawn map on top of it.
How do the market's signals reveal tightness or slack?
Three gauges carry the information. Exchange inventories — warehouses registered with the London Metal Exchange, New York's COMEX, and Shanghai — are the visible buffer; falling stocks alongside rising prices mark a market consuming its cushion. The spreads between cash and futures contracts do similar work quietly: backwardation, where spot copper trades above deferred deliveries, signals immediate scarcity better than any headline price. And physical premiums over benchmark prices — paid by real fabricators for real metal in regional markets — measure what consumers will pay to hold physical units now. When all three point the same way, the market is voting on the balance; when they diverge, the divergence itself is the story, usually of financial flows outrunning warehouses.
Who are the swing buyers and what do they do?
China is the demand center — roughly half of world consumption — and its state-linked entities have long treated copper as a strategic stockpile, buying aggressively in price weakness. Grid investment, state-directed and less price-sensitive than private manufacturing demand, has grown into a large share of Chinese offtake, and official stimulus programs repeatedly target electrified infrastructure, per Chinese planning documents. The rest of demand splits across construction, machinery, transport, and consumer goods — cyclical sectors that respond to interest rates and housing cycles. This structure means copper prices increasingly respond to two masters: Chinese infrastructure policy and global transition build-out, with Western manufacturing somewhere down the list.
Can substitution and thrift break the squeeze?
Partially, and the honest answer credits it. Aluminum substitutes for copper in some conductor and cooling applications where its lower conductivity is tolerable — utilities already run aluminum overhead lines. Manufacturers economize: thinner windings, copper-clad alternatives, redesigned busbars all shave percentages off intensity per unit. Theft-recovery and scrap collection improve with price incentives. But substitution physics is unforgiving — aluminum conducts about sixty percent as well, so more metal volume is needed per ampere — and the applications where copper is hardest to replace, motors and small windings, are exactly the ones electrification multiplies. Substitution bends the demand curve; it does not repeal it.
Thrift has a further limit the engineering literature documents well: redesigning a motor winding or busbar around a cheaper conductor costs engineering time, certification, and warranty risk — costs that make sense at the margin for new designs and none at all for retrofitting installed stock. The stock of copper already embedded in the world's machines turns over on multi-decade schedules, so even aggressive substitution assumptions leave transition-era additions demanding copper at the mine gate for years to come.
What do the forecasts actually say, and how much should we trust them?
They say scarcity, with a spread of magnitudes. Industry bodies like the International Copper Study Group publish balances that swung between modest surpluses and deficits in the mid-2020s depending on the year; longer-horizon studies — from commodity research houses and major miners' own outlooks — project structural deficits in the 2030s measured in millions of tons, with peak-demand estimates labeled as estimates precisely because they extrapolate policy. The skeptics' counterpoint has weight: every past "permanent shortage" forecast in metals has eventually met demand destruction, new supply, or both — copper's own 2000s supercycle spike invited a decade of response. The disciplined position holds both: the direction of pressure is real and documented; the magnitude and timing carry forecast risk that honest analysis states rather than hides.
What should readers watch to track the question?
A handful of public series does the work: USGS and ICSG production and balance data for the physical picture; exchange inventories on the LME, COMEX, and Shanghai Futures Exchange for the market's tightness gauge; Chilean and Peruvian output statistics for the largest supply swing; Chinese grid investment figures for the demand swing; and tariff policy news for the trade overlay. When inventories fall alongside rising prices and rising premiums, the squeeze is being priced; when stocks build during strength, skepticism is warranted. The data is public, frequent, and free — which is more than can be said for certainty about 2035.
Where can readers verify the numbers?
The U.S. Geological Survey's mineral commodity summaries publish annual world production and reserves free on its site; the ICSG publishes monthly balances; exchange inventory data updates daily. The primary sources here are unusually accessible, and a reader who follows them quarterly will track the electrification copper story as well as any analyst desk.