Industrial uses take roughly six of every ten ounces of silver the world consumes, and photovoltaic cells alone absorbed more than thirty percent of total demand in the mid-2020s — around 230 million ounces in recent years, per Silver Institute data — a structural claim on the metal that did not exist when silver's price story was about coins and photography. The old monetary metal has become a solar-industrial input.
What is silver's demand actually made of?
Three blocks, unlike in character. Industrial fabrication — everything from solar cells and electronics to brazing alloys and bearings — is the majority, roughly sixty percent, price-sensitive at the margin and cyclical with manufacturing. Jewelry, silverware, and gift-grade demand form the second block, concentrated in India and China, price-aware in the everyday sense: buyers step back when prices spike. Investment — bars, coins, and exchange-traded fund holdings — is the third and smallest by volume but the most volatile, since it moves with sentiment and rates the way gold's investor demand does. Silver's price behavior is a weighted blend: too industrial to trade purely like gold, too monetary to trade purely like copper — which is why analysts call it a hybrid and why its beta to both stories confuses strategists raised on either one alone.
Why does solar use so much silver?
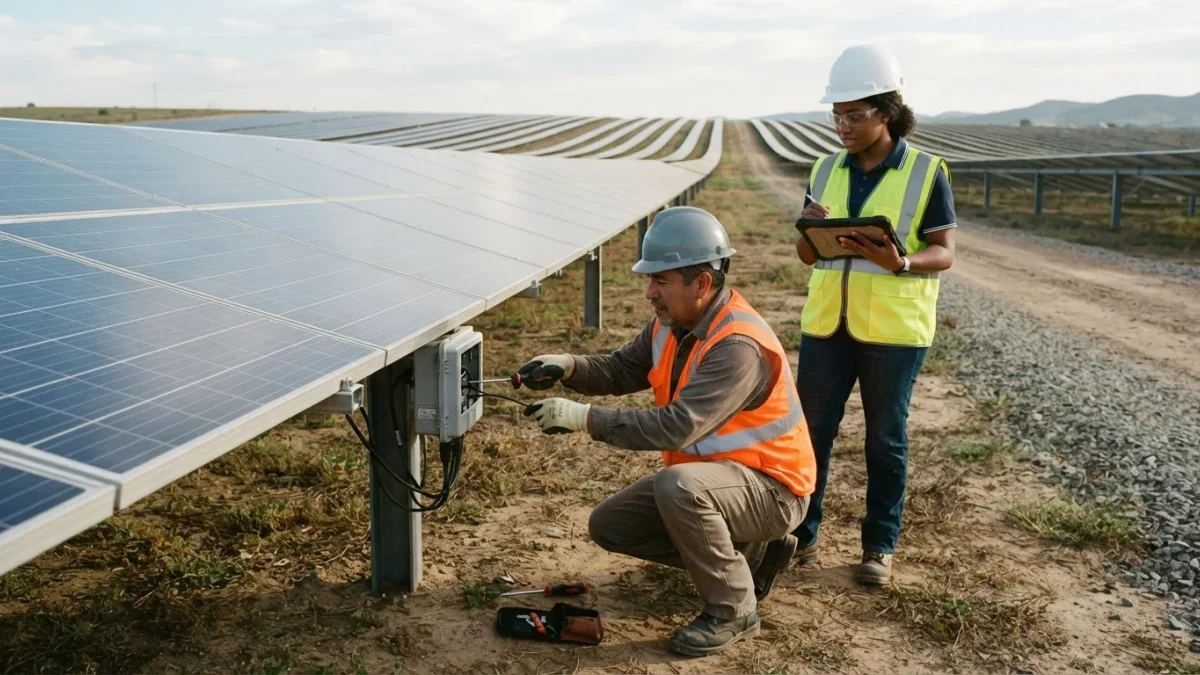
Physics, so far undefeated by engineering. Photovoltaic cells use silver paste as the conductor that gathers electrons from silicon; no common substitute matches its conductivity and contact performance at cell efficiencies the market will buy. A typical panel contains a modest fraction of an ounce, but the installed base is measured in terawatts now: solar deployment of recent years implies the roughly two-hundred-plus million ounces the industry reports, and Silver Institute analyses project continued growth under expanded installation scenarios, labeled as projections. Thrift is working against the intensity — manufacturers have spent a decade reducing grams-per-watt through paste chemistry and plating tricks, and cell architecture shifts like the move to new top-contact designs cut usage further — but deployment volume has outrun intensity reduction every year so far, per the same data. That race — efficiency engineering versus terawatt growth — is the demand story of the decade.
Where does silver supply come from?
Mostly as a byproduct, which is the structural twist. Only around a quarter to a third of mined silver comes from primary silver mines; the majority arrives as a byproduct of lead-zinc, copper, and gold operations, per industry statistics. This changes the supply response fundamentally: when silver prices rise, primary silver mines can expand, but byproduct supply depends on base-metal economics — copper mine plans do not change because silver rallied. Silver's supply curve is therefore borrowed from other metals' capex cycles, and the price can rise substantially without calling forth proportionate new supply. Recycling contributes a meaningful slice — industrial recovery and, notably, photovoltaic recycling as early panels retire, a stream expected to grow with the installed base's age.
What happened to prices in the 2020s?
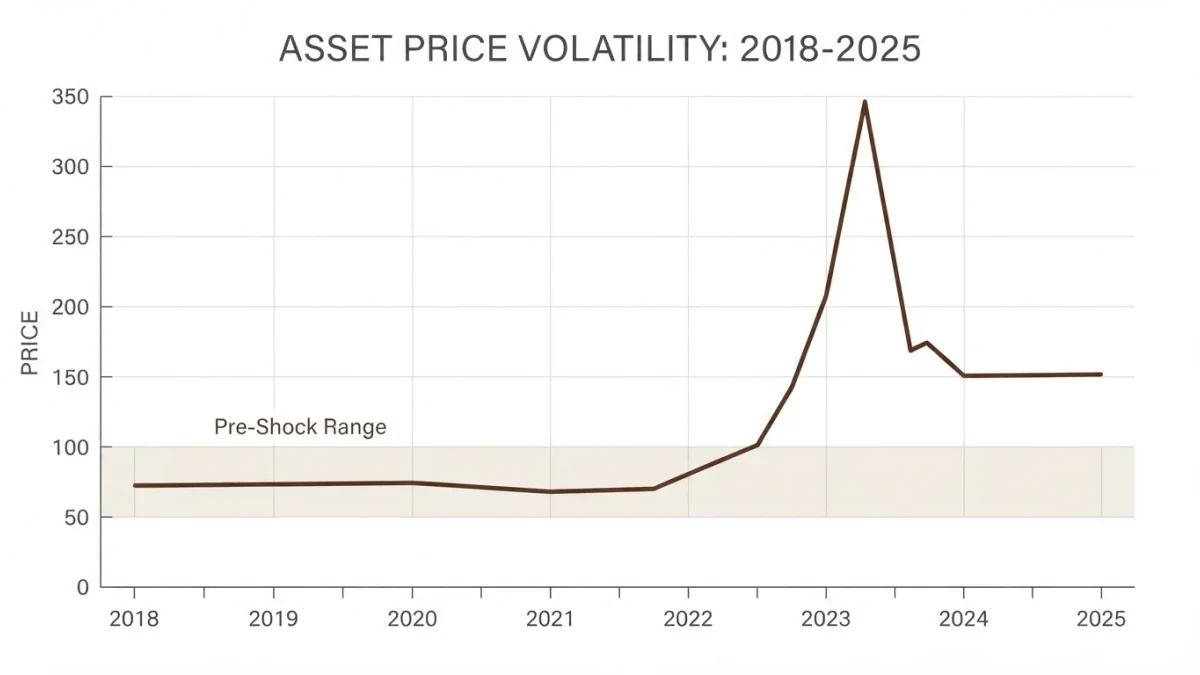
A widening physical squeeze under a rising monetary tide. Silver spent 2020-2021 rallying with gold and industrial recovery; the 2022 rate shock pressed it back toward eighteen dollars; then 2024-2025 brought the strongest run since 2011-2012 — prices rose from the low twenties above thirty and kept climbing past fifty-dollar milestones in late 2025 in some sessions, per exchange data, with gold's record run and the solar demand narrative feeding each other. The exchange-traded funds, which had bled holdings for years, stabilized and drew inflows; industrial premiums for immediate delivery in some hubs outpaced benchmarks — the market pricing physical tightness, not just sentiment. The structural deficit — consumption above mine and recycling supply, filled from above-ground stocks — has persisted for several consecutive years in Silver Institute accounting, a run of deficits that distinguishes this episode from pure monetary episodes like 2011.
What is the deficit-and-stocks mechanism?
The market's shock absorber and its warning light. Because byproduct supply cannot chase price, and industrial demand is slow to re-engineer away from silver in existing designs, the market balances by drawing down identifiable above-ground stocks — exchange vaults, ETF holdings, and reported bullion inventories. Multi-year deficits shrink that buffer; when estimates of remaining liquid stocks fall toward the low billions of ounces — months of industrial demand — small shifts in investment flows move prices violently, because the marginal buyer faces a thinner physical float. That is the 2024-2025 configuration, per the Institute's balances: not a shortage of silver on Earth, but a shortage of silver for sale at recent prices. Squeezes in a market this small resolve either through price rising enough to destroy demand — substitution, thrifting, inventory release — or through new primary supply across multi-year lead times.
What about substitution risk — can solar engineer silver out?
Gradually, at the edges, and honestly not soon for the installed mainstream. Copper pastes and reduced-silver designs exist and ship in volume, and the industry's roadmap — published by industry research bodies — targets substantial grams-per-watt reductions; but contact resistance and efficiency losses have kept silver dominant in mainstream cell architectures, and switching costs in a price-competitive module market are real: a manufacturer sacrifices fractions of a percentage point of module efficiency at its peril when bids are won on cents per watt. The pragmatic reading of two decades of thrift data: intensity per watt falls steadily, total demand still rises, and the crossover year keeps moving — the same race described above, with engineering winning battles and deployment winning wars.
How does gold set silver's floor?
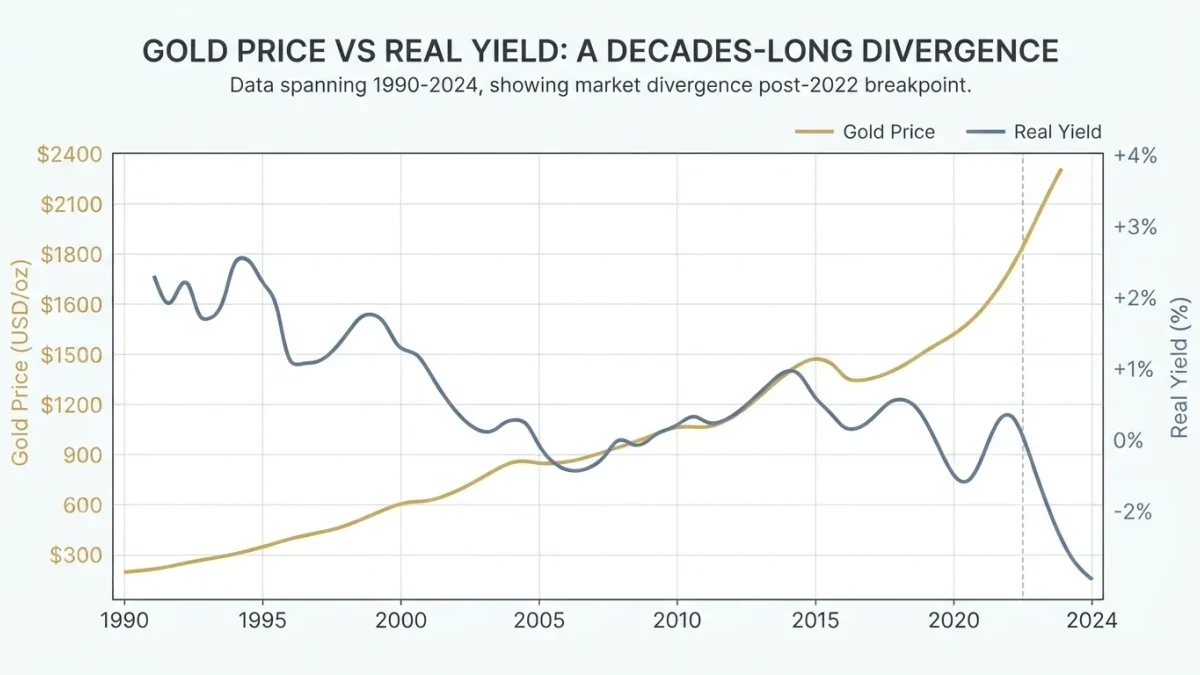
Through the monetary half of the hybrid. The gold-silver ratio — how many ounces of silver buy one ounce of gold — has ranged from roughly sixty to one hundred in the modern era, and its behavior tells which half of silver's identity is driving: the ratio falls when silver's industrial half leads, as in solar-boom years, and rises toward the hundreds when monetary fear dominates and silver is sold like a risk asset. Through the 2024-2025 run the ratio compressed meaningfully from its historic-peak neighborhood toward multi-year lows — silver outperforming gold, the signature of the industrial narrative taking the wheel, per market data. Ratio-watching is descriptive, not predictive; but it is the cleanest single dial on the hybrid's toggle, and it quotes daily.
How did 2020s market plumbing change the story?
Two structural shifts in how silver trades deserve their own paragraph. First, the London over-the-counter market — the historical center of wholesale silver — now shares price-setting with exchange-traded funds and Comex futures to a degree that older analyses understate: ETF inflows remove metal from the float available for lease, tightening the very inventories that industrial users borrow against, and large Comex positioning can squeeze a physically small market. Second, retail coin and bar demand has become a genuine swing factor in shortage years — mint rationing episodes during demand surges repeatedly widened retail premiums over wholesale by multiples. The modern silver market is a three-body problem — London bullion banks, exchange positioning, and physical industry — and price episodes usually involve at least two of the three interacting.
What should readers watch to follow the story?
Five public series carry it: the Silver Institute's annual and interim supply-demand balances for the deficit's path; exchange vault inventories and ETF holdings for the float; the gold-silver ratio for the toggle; solar installation statistics from industry bodies for the demand driver; and, for the monetary half, the same real-rate and central-bank context that governs gold. The story is unusually well-instrumented for a small market, and each instrument answers one question the others cannot.
Where can readers get the numbers?
The Silver Institute publishes its survey data and deficit accounting publicly; exchange inventory data quotes daily; USGS mineral summaries cover mine supply and reserves; and gold's framework — Treasury TIPS data, reserve statistics — carries over from this series' earlier treatment. The hybrid is documented, the instruments are free, and the solar claim on silver is measurable in ounces anyone can check.