America's natural gas market reliably cuts prices in the autumn injection season and doubles or triples them in a cold winter's withdrawal weeks: front-month Henry Hub futures traded below two dollars at points in 2024's warm winter and spiked toward four within months when cold arrived, per exchange price records. No other major commodity has a seasonal heartbeat this pronounced.
What is Henry Hub and why does one number matter?
Henry Hub, in Erath, Louisiana, is the interconnection of more than a dozen interstate and intrastate pipelines and the delivery point for the New York Mercantile Exchange's natural gas futures contract. Because the contract physically settles there, the Henry Hub price became the continental benchmark — the reference off which most domestic gas trades at hub-specific differentials. The United States produces around one hundred billion cubic feet of marketable gas per day, per federal statistics, making it both the world's largest producer and, since 2023, the largest exporter of liquefied natural gas. The benchmark's moves therefore ripple into household heating bills, power prices, and international cargo economics at once.
How does the storage cycle structure the year?
The market's calendar has two seasons by design. From roughly April through October — the injection season — demand runs below production, and the surplus is pumped into roughly four hundred underground storage reservoirs, mostly salt caverns and depleted fields, with working capacity near five trillion cubic feet nationally. From November through March — the withdrawal season — heating demand exceeds production, and storage drains to cover the gap, typically bottoming in late March before the cycle restarts. The Energy Information Administration reports the national storage level every Thursday at 10:30 a.m. Eastern, and it is to gas what the Wednesday oil report is to crude: the market's weekly physical scorecard, with each release compared against the five-year average band that defines "normal."
Why does weather dominate so completely?
Because the marginal user in winter is heating, and heating demand is weather. A shift of a few degrees in November-to-February average temperature changes national consumption by tens of billions of cubic feet over a season — a quantity comparable to the output of entire producing regions — and supply cannot respond on that timescale, since wells and pipelines are built for average, not extreme. Storage is the shock absorber, and its depth is finite: a cold winter can draw inventories toward operational minimums, at which point price becomes the rationing mechanism, which is why cold snaps produce the market's famous spikes. The February 2021 Texas freeze remains the extreme exhibit — regional spot prices spiked by orders of magnitude as wells themselves froze and demand surged simultaneously, per federal after-action reviews, a supply-and-demand shock in the same week.
What happened to prices in the 2020s?
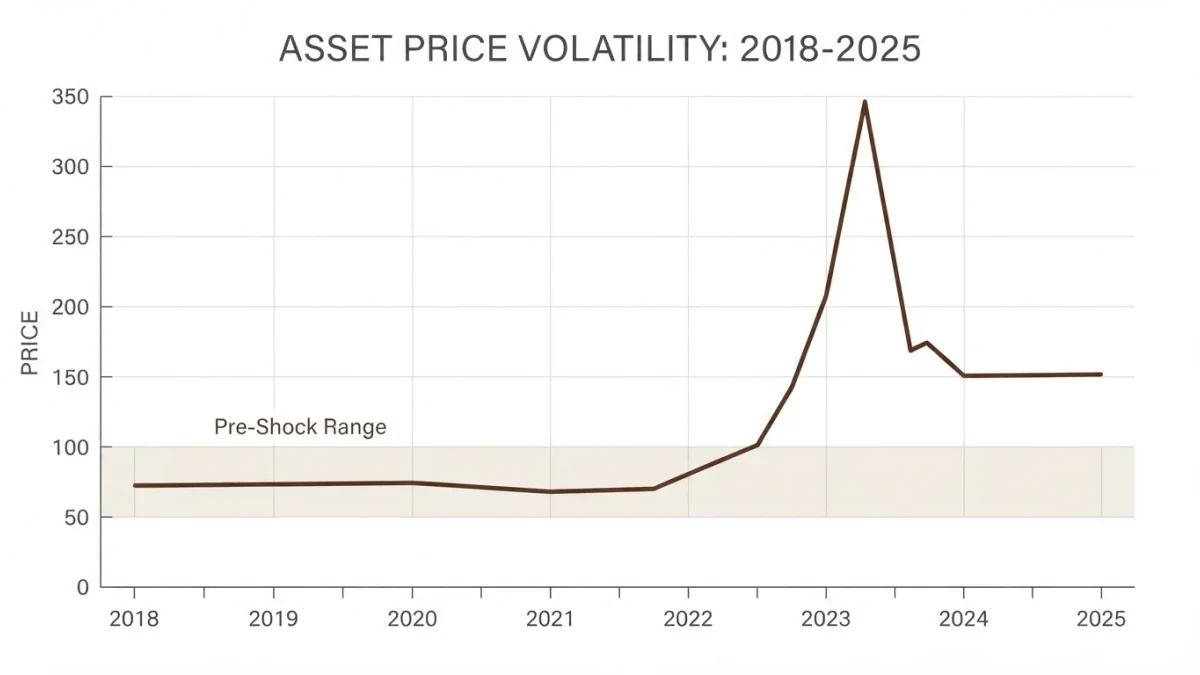
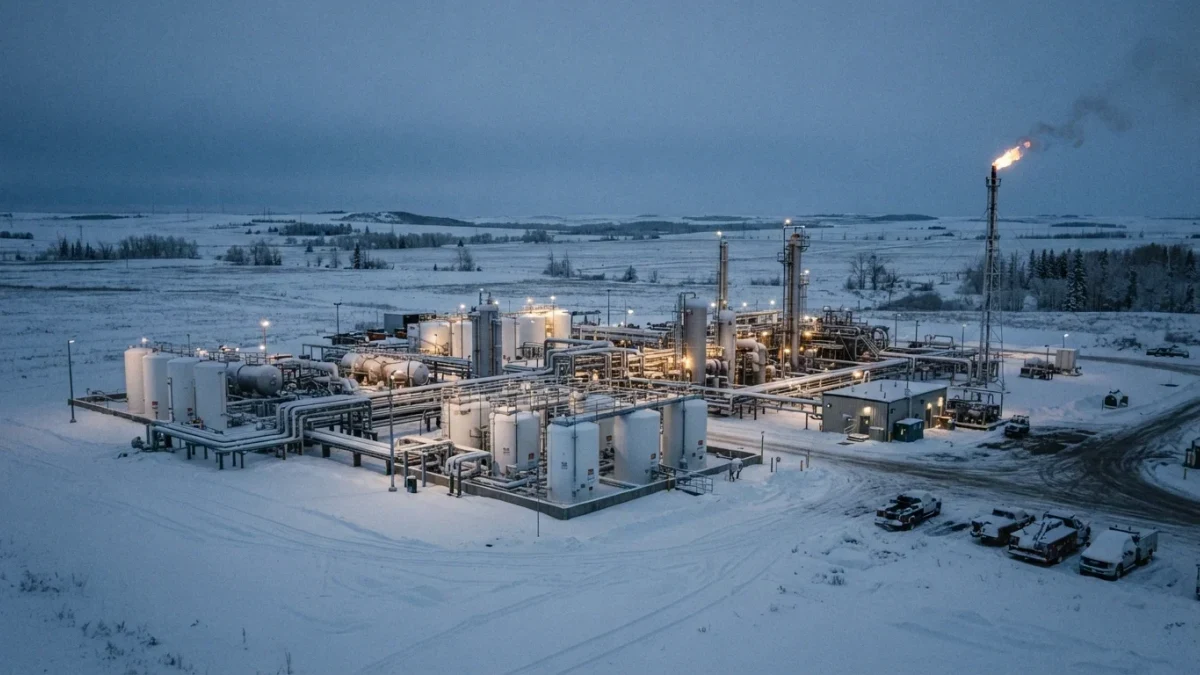
A decade-long story of shale abundance interrupted by two shocks. Through the late 2010s, prolific Appalachian and Permian supply held Henry Hub near two to three dollars — so low that associated gas from oil wells was sometimes flared as a nuisance. Russia's 2022 invasion of Ukraine repriced global gas: Europe scrambled for LNG cargoes, U.S. export demand surged, and Henry Hub futures spiked toward ten dollars, per exchange records — then the June 2022 accident at the Freeport LNG terminal cut export capacity overnight and prices halved within weeks, a clean demonstration of how export infrastructure now sets the ceiling and floor. The winters of 2022–2023 and 2023–2024 then ran warm; storage ended those seasons near record highs, and futures sagged back toward the low twos, with early 2024 marking some of the lowest real prices in decades. The 2020s' range — roughly two to ten dollars inside four years — is the seasonal machine amplified by geopolitics.
How does LNG export demand change the cycle?
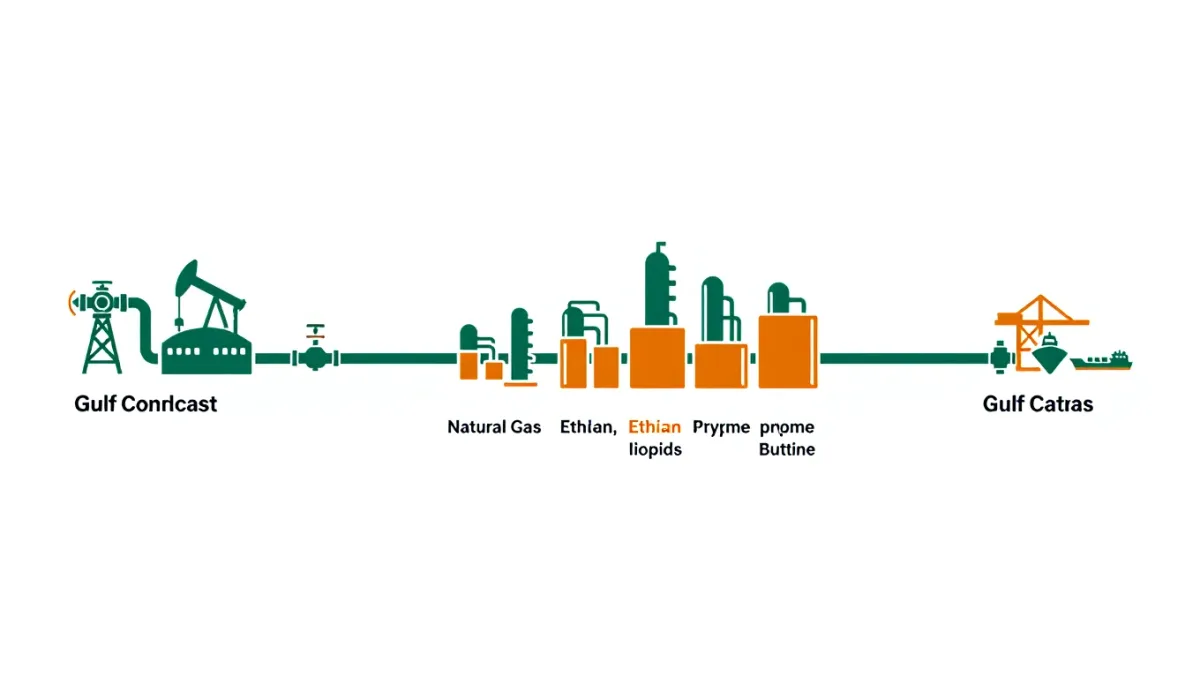
By connecting the American storage cycle to world prices. Export terminals buy domestic gas, chill it to liquid, and ship it abroad; export capacity grew to roughly thirteen-plus billion cubic feet per day by the mid-2020s, making overseas demand a structural new consumer on top of heating and power. The arithmetic caps both directions: when U.S. prices fall far below global LNG netbacks, exporters buy more, cushioning the floor; when U.S. prices spike, cargo economics deteriorate and exporters throttle back, softening the ceiling. In January 2024 the government's pause on new LNG export permits added a policy layer — resolved by lifting the pause in 2025, per official announcements — reminding the market that the export channel is not just economics but permission.
What about demand from power and data centers?
The newest layer of the stack. Gas is the largest single fuel for U.S. electricity generation — around forty percent in recent years, per EIA data — and gas-fired plants are the swing supplier for hot summers, when air conditioning peaks and power burn rivals winter heating demand, giving the market a second seasonal hump in July-August. The 2024–2025 wave of announced data-center construction for artificial intelligence added a forward demand story: technology companies and utilities have cited multi-gigawatt gas power needs later this decade, figures that appear in utility filings rather than current statistics. For now these are announcements, not molecules — but the market has begun pricing summers and shoulder seasons with an electricity overlay that did not exist five years ago.
Who actually trades the seasonal spread?
A professional ecosystem with a division of labor. Producers sell forward and store gas when the summer-winter spread covers the cost of storage capacity — the classic cash-and-carry trade. Utilities and local distribution companies hedge winter supply months ahead, smoothing household bills. Hedge funds and prop desks trade weather forecasts against positioning, which is why the market's reactions often front-run actual temperatures. And LNG portfolio players arbitrage Henry Hub against global benchmarks, physically shipping the spread. The household consumer sits at the end of all this plumbing, usually hedged, occasionally reminded — by a winter bill — that the commodity beneath the meter is one of the most weather-leveraged assets in finance.
The storage calendar also explains a pattern newcomers find strange: autumn often brings the year's weakest prices even as forecasters talk up winter risk. November futures price the end of injection season, when inventories are at their fullest and heating demand has not yet arrived — the market's most abundant moment. The same asymmetry runs in reverse in late winter, when futures can firm even as spot prices sag on mild March weather, because the market is already buying the next injection season's starting point.
How should a careful reader follow the market?
Three public series do most of the work: the EIA's Thursday storage report against its five-year band; the National Weather Service's heating-degree-day outlooks through the winter; and the EIA's weekly domestic production and LNG feedgas estimates. Add exchange price data for the strip of monthly futures, and the seasonal story — injections ahead of or behind schedule, weather deviations, export pull — reads directly from free sources. The market punishes certainty about weather, which no reader should carry; it rewards structural literacy, which any reader can build.
Two habits sharpen the practice. Track the storage trajectory as a deviation from the five-year average rather than in absolute terms — a market eleven percent above normal in February is a different animal from one one percent above normal in November, even at identical absolute levels. And watch the summer-winter futures spread rather than the outright price alone: the spread is where the market quotes the cost of carrying gas through the shoulder season, and its behavior through the year often says more about balance than the front month's headlines.
Where can readers get the data themselves?
The EIA's natural gas portal publishes storage, production, prices, and the short-term outlook free; exchange sites quote futures; the National Weather Service publishes the seasonal outlooks the market trades. As with every market in this series, the primary sources are public, timely, and better than any summary — this one included.