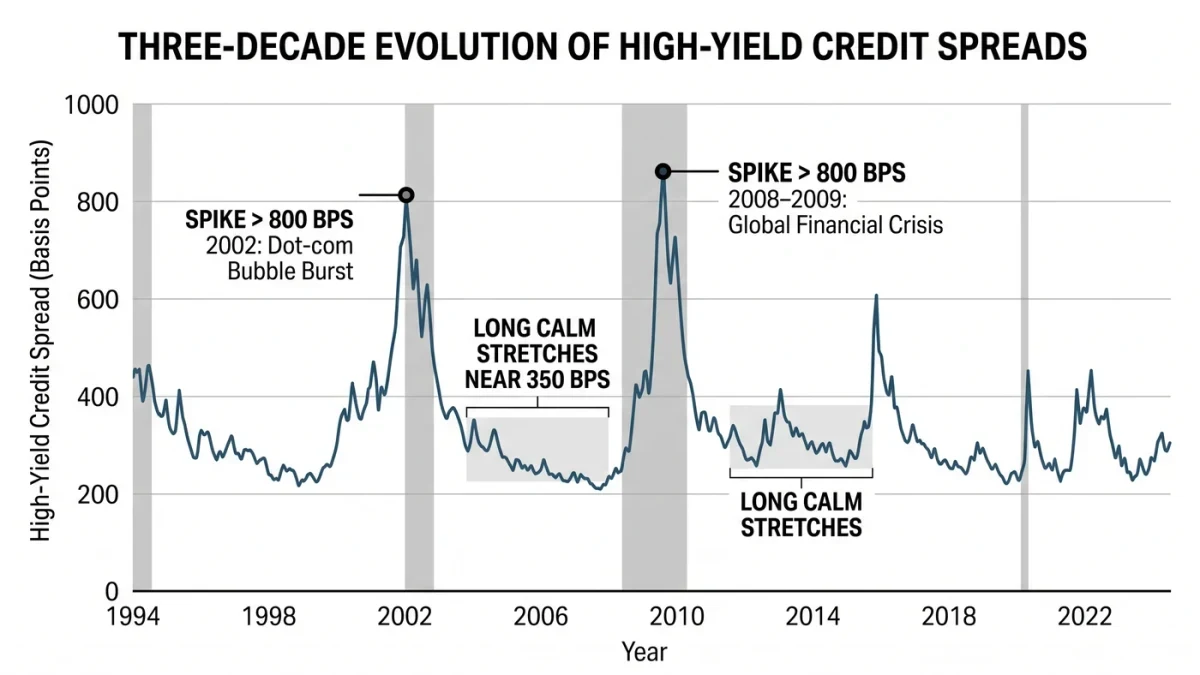

Before the 2001 recession, before 2008, and before 2020's collapse, high-yield credit spreads widened materially ahead of the equity market's worst damage — the gap between junk-bond yields and Treasuries is one of the few market indicators with a documented record of leading recessions rather than following them, per Federal Reserve and academic studies of spread behavior across cycles. The signal is imperfect — spreads also widen without recessions — but it is priced continuously by money at risk.
What is a credit spread?
The extra yield a corporate bond pays over a Treasury of similar maturity — the price of credit risk expressed in basis points. A Treasury is the risk-free benchmark; a corporation can default, so its bonds must pay more. Investment-grade spreads — highly rated companies — have historically traded in the roughly one-to-two-percent range; high-yield spreads — below-investment-grade, "junk" — in the three-to-six percent range in calm times, with crisis excursions far beyond: over twenty percent at the worst of 2008 and near eleven percent in the pandemic panic, per index data. The spread isolates credit risk from interest-rate risk: when Treasury yields move, both bonds reprice together, and the gap between them changes only when the market's assessment of default risk changes.
Why do spreads lead the economy?
Because credit is the economy's oxygen, and lenders price deterioration before statisticians measure it. A widening spread says bond investors are demanding more compensation for the same exposure — they see rising default probability in their borrowers' order books, their creditors' behavior, their own restructuring pipelines. Companies feel the tightening through borrowing costs immediately: refinancing at wider spreads cuts into the cash flows that fund employment and investment, transmitting financial fear into real decisions. The signal's structure explains its timing: bond markets aggregate continuous, high-stakes assessment of hundreds of issuers' health, so distress appears in spreads quarters before it appears in default data — defaults themselves are a lagging indicator, arriving after the damage. Spreads widen on the expectation; the recession, if it comes, is the confirmation.
The channel has a corporate-finance mirror that makes the mechanism concrete: the maturity wall. When a cohort of bonds comes due, issuers must refinance at whatever spreads prevail — wide spreads at the wrong moment convert a solvent-but-levered company into a distressed one, which is why analysts chart upcoming maturities against market access. The wall is public data, and its size in any year is a measure of how much the economy has scheduled a negotiation with the credit market.
What is the actual track record?
Good, with documented false alarms. Spread widening preceded the 1990-91 recession, the 2001 tech bust (high-yield spreads had blown out with the telecom-debt collapse), and was both a leading and coincident signal of 2008 — the mortgage crisis was itself a credit-spread event, with spreads screaming from mid-2007 onward. The false positives are real and instructive: 2015-2016's energy-bust spread widening — high-yield spreads jumped past eight percent on the oil collapse — presaged an industrial slowdown but no recession; 2022's rate-shock widening reflected inflation and rate volatility, not an imminent default wave, and narrowed again without a downturn. The honest base rate: most recessions were preceded by significant widening, but most significant widenings were not followed by recession — which makes spreads a necessary gauge to watch, not a sufficient one to trade.
Which spread measures should a reader track?
The main families, each with a personality. The benchmark option-adjusted spreads on investment-grade and high-yield corporate indices — published daily from index providers — are the standard gauges. High-yield is the more sensitive: its issuers are closest to default, so it moves first and furthest. The relative shape matters too: the ratio of high-yield spreads to investment-grade spreads widens when fear concentrates in the weakest credits. Bank-loan and distressed-debt indicators — default rates, recovery rates, the share of distressed issues trading — form the confirmation layer. And the breakeven-style implied defaults — what current spreads imply about expected default losses — translate the market's language into probabilities, an arithmetic this publication recommends over adjectives.
What is the equity-versus-credit divergence telling?
A comparison worth institutionalizing: when stock prices and credit spreads disagree, history usually sides with credit. Equity valuations discount long-horizon cash flows and can carry narratives through weakness; bondholders are paid back in full or not at all, so their pricing is a blunter claim on near-term solvency. The 2007-2008 sequence is the canonical exhibit — credit spreads deteriorated for a year while equities made new highs into October 2007, and the bonds were right. Analysts formalize the check by comparing the implied default expectations in spreads against equity volatility measures: large gaps between what the two markets price are themselves a signal, quantified in the academic literature on the credit-equity puzzle. A reader's practical version needs only two charts on the same page — index level and high-yield spread — and the habit of asking, whenever they diverge, which one is lying.
How did spreads behave in the 2020s?
A full round trip with two instructive chapters. The pandemic collapse of March 2020 took high-yield spreads from near-three-and-a-half to nearly eleven percent in weeks — faster than 2008 — before Federal Reserve interventions, including corporate bond purchases, compressed them with equal violence; the episode demonstrated both the signal's speed and its new sensitivity to central-bank put. The 2022-2026 cycle then ran unusually: spreads widened through the rate shock to roughly five percent on high-yield but stayed historically tight through the earnings strength of 2024-2026 — tighter than the pre-2008 norm, in fact — while private credit absorbed borrowers off-index, as this publication's private-credit analysis covered. The standing question, honestly stated: with a growing share of leveraged lending in private markets, the public spread gauges may be reading a shrinking share of the credit system — a measurement caveat that did not exist in prior cycles.
What are the signal's limitations?
Four. False positives, quantified above — energy busts and rate shocks widen spreads without recessions. Central-bank dampening: the knowledge that the Fed or European Central Bank may buy corporate debt in crises caps how far spreads can price catastrophe, arguably muting the signal's tail. Reach-for-yield compression: in yield-hungry regimes, spreads compress below what fundamentals justify — tight spreads signal complacency as loudly as wide spreads signal fear, and the 2007 experience — spreads near historic tights into the crisis — is the canonical warning. And coverage drift: public bond indices exclude the private-credit market's growing share, making the aggregate gauge less complete than it was.
How should a reader use spreads in practice?
As one dial on a documented dashboard. Track the level against its own history — percentile ranks against twenty years of data convey more than raw basis points. Watch the direction and speed: gradual widening in high-yield alongside rising defaults is a cycle; a vertical spike is a panic, and the two have different meanings. Cross-check against the confirmation layer — loan delinquencies, default rates, bank lending standards in the Fed's senior loan officer survey — and against equities' own credit assumptions. And respect the asymmetry the record shows: spreads at extreme tights have historically carried as much information as spreads at extreme wides, in the opposite direction. The dial reads fear and complacency equally; the disciplined reader takes both readings.
Where can readers get the data?
Index providers publish option-adjusted spreads daily; the Federal Reserve's statistical releases and financial stability reports track corporate credit conditions; the senior loan officer survey publishes quarterly; and default tallies come from the rating agencies' public research. The series are free, current, and long — enough history to compute your own percentiles, which is the whole practice: numbers against their own past, rather than adjectives against the present.
And one habit of mind completes the practice: spreads are a market price, not a measurement of defaults. They move on expectation, liquidity, and positioning as well as on fundamentals — the 2020 snap-back proved how fast the expectation dial can spin when the buyer of last resort appears. Reading the dial means reading what moves it, not just where it points.