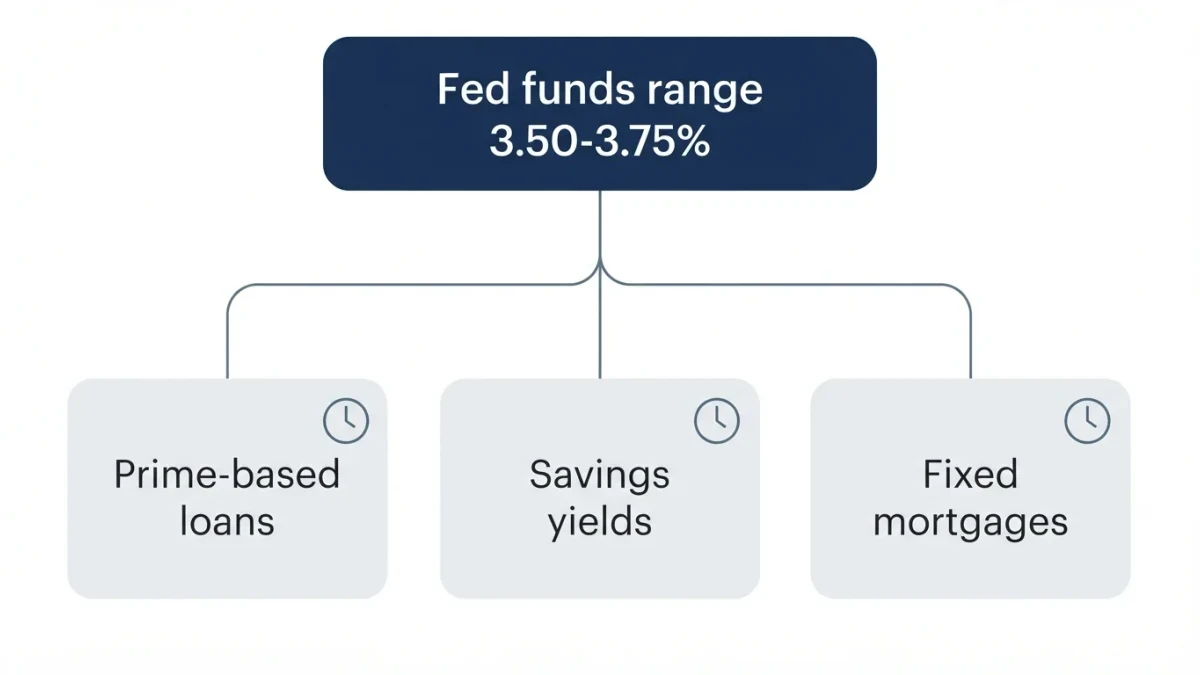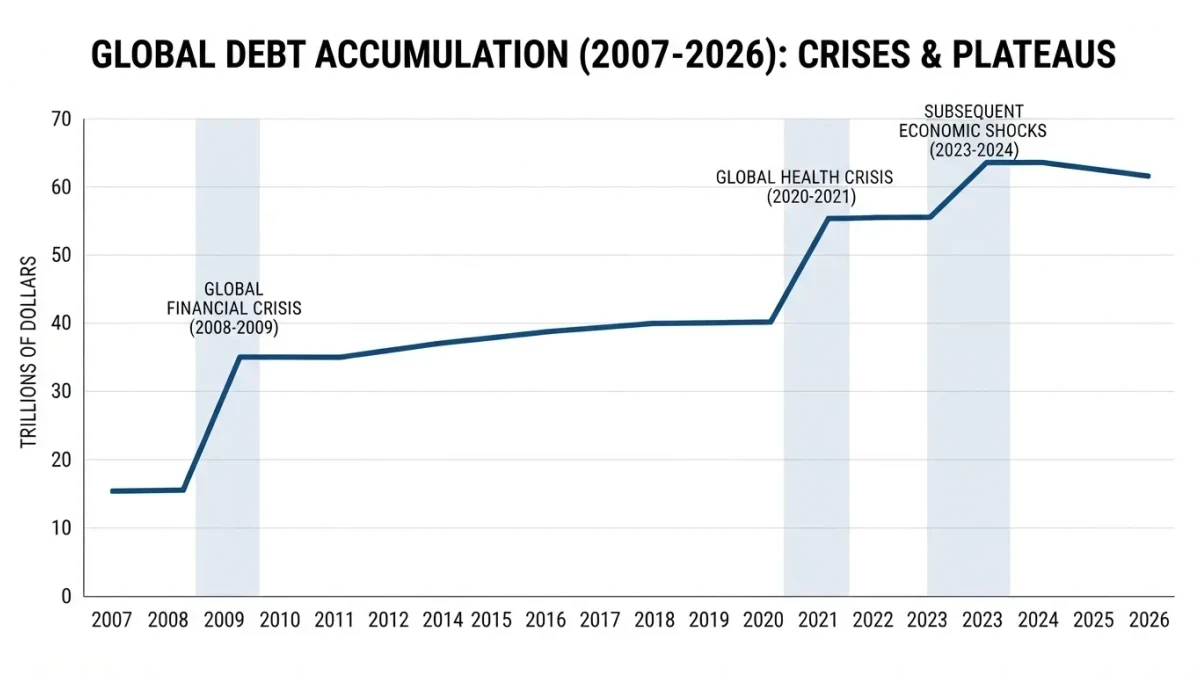

The Federal Reserve does not simply declare what interest rates shall be — it sets a target range for the federal funds rate (3.50 to 3.75 percent as of January 2026, per the Fed's own statements) and then uses two administered rates and a standing facility to hold the market's overnight rate inside that corridor. The machinery beneath the declaration is one of the world's largest continuous financial operations. Market Today publishes information, not investment advice, and this explainer covers how the rate-setting actually works, from committee vote to money-market plumbing.
What is the federal funds rate?
The overnight interest rate at which banks lend reserves to each other. Every bank maintains an account at its Federal Reserve District Bank holding reserve balances; a bank with excess reserves overnight can lend them to a bank short of requirements, and the price of that lending is the federal funds rate — the base of the entire dollar rate structure. Since 2008, the system has operated with abundant reserves: the Fed supplies far more reserve balances than banks strictly require, which changed how the rate is controlled. The old system drained reserves until lending rates landed at the target; the current system pays banks to hold reserves and steers the market rate with administered rates — a floor system, in the technical language.
Who decides and how?
The Federal Open Market Committee — twelve voting members: the seven Board governors, the New York Fed president, and four district-bank presidents rotating annually. The committee meets eight times a year in Washington; staff presentations cover economic conditions, forecasts, and policy options; the committee votes on the target range; and the decision publishes at 2:00 p.m. Eastern with a statement whose every comma markets parse. The January 2026 meeting, as this publication reported, held the range at 3.50–3.75 percent — a pause in the easing cycle that had begun in late 2024. Minutes publish three weeks later, and four times a year the committee's economic projections — the famous dot plot of individual rate expectations — accompany the statement, moving markets as much as the decision itself.
What are the two administered rates?
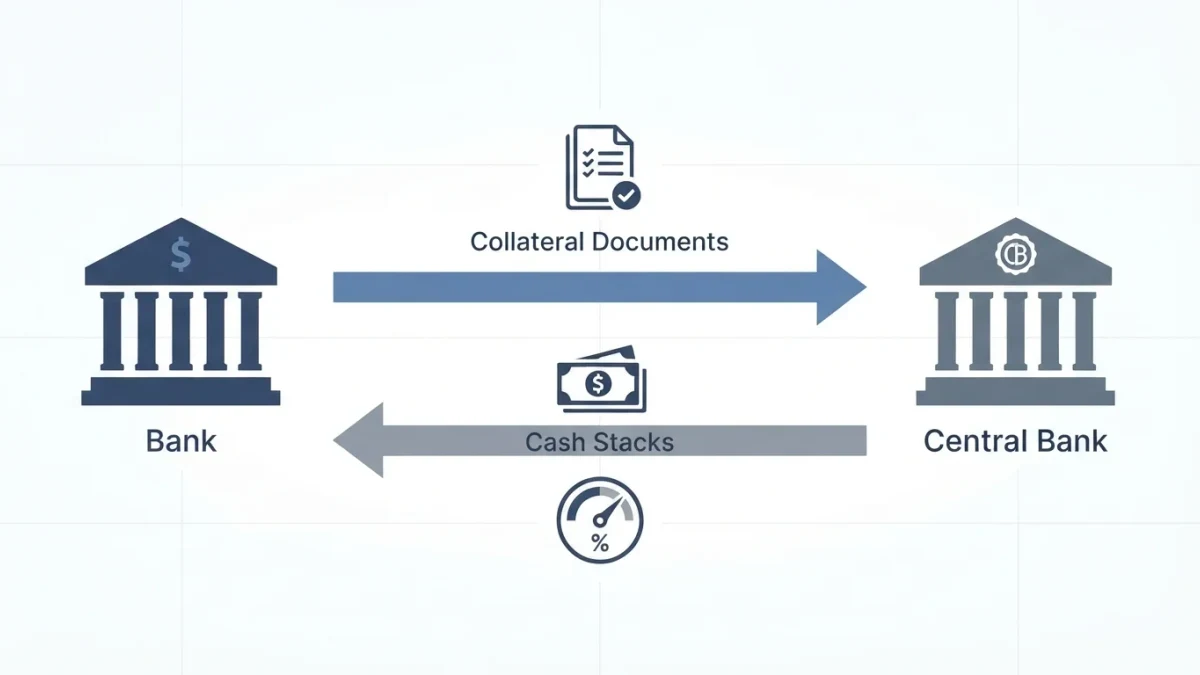
The floor system's steering mechanism. Interest on reserve balances — the IORB — is the rate the Fed pays banks on the reserves they hold; banks will not lend to each other below what the Fed pays them risk-free, so IORB forms the floor's anchor. The overnight reverse repo facility — ON RRP — offers money-market funds and other eligible institutions the chance to park cash at the Fed overnight at a set rate, extending the floor to non-banks. With the target range at 3.50–3.75, the Fed has been setting IORB at the top of the range and the ON RRP rate at the bottom — a narrow spread chosen deliberately in abundant-reserves conditions, per the Fed's implementation notes. The market's effective federal funds rate trades between them, and it has held inside the range with remarkable reliability through rate cycles, Treasury-market stresses, and balance-sheet changes.
What does the New York Fed's desk actually do?
Operations, daily. The Open Market Trading Desk at the Federal Reserve Bank of New York conducts the mechanical side of policy: it monitors the effective funds rate every morning, and when the rate threatens to drift, it can adjust operations — including, since 2021, the Standing Repo Facility that lends to primary dealers against Treasury collateral, capping upward pressure from below. The desk also implements balance-sheet policy: under quantitative tightening, the Fed allows maturing securities to roll off its portfolio rather than reinvesting them, shrinking reserves as a by-product — the quantity side of the monetary system that the desk manages against the interest-rate targeting. The Desk's daily statements publish every morning: for a system this consequential, its operations report is remarkably short.
What is the dot plot and why does it move markets?
Four times a year, each FOMC participant — not just voters — submits their projection of the appropriate funds rate at year-ends ahead, and the scatter of those points publishes as the Summary of Economic Projections. The dots are individually anonymous and collectively watched: markets read the median as the committee's implied path, and shifts of even one dot in the year-ahead column have moved two-year yields measurably on release days. The honest framing, which the Fed itself attaches, is that the dots are forecasts conditional on each participant's economic outlook — not commitments. Participants revise as data arrives: the 2025 experience of shifting projections, and the January 2026 hold that this publication covered, showed the median following the economy rather than leading it. Reading the dots as a promise builds forecast error into expectation; reading them as a snapshot of distributed judgment is what they are.
How does the decision reach a mortgage or a savings account?
Through a transmission chain of repricing, each link at its own speed. The overnight rate anchors the front of the yield curve directly. Short-term consumer rates follow within days: savings yields, money-fund returns, credit-card pricing all reference the funds rate or its near substitutes. Longer rates — mortgages, corporate bonds — reprice through expectations of the future path of the funds rate, which is why a single meeting can move thirty-year mortgage quotes by moving beliefs about the next two years of meetings. The real economy responds last and slowest: borrowing costs influence housing and investment decisions over quarters and years. This lag structure — fast financial transmission, slow economic transmission — is why the committee argues about inflation forecasts rather than last month's data: policy works on the future it is trying to steer.
Transmission has a bookmark every reader already owns: the savings-account yield. When the Fed moved from near zero through 5.25–5.50 and back down to 3.50–3.75 across 2022–2026, bank deposit rates followed with famous lag — a lag that is itself a finding, quantified in bank margin data, about who captures the difference while it lasts.
What are the modern critiques of the framework?
Three with institutional weight. Reserve scarcity questions: quantitative tightening has shrunk reserve balances from their peaks, and episodes — September 2019's repo spike, documented in this publication's yield-curve analysis — showed the floor system can wobble when reserves approach the banking system's true demand, prompting the standing facilities built since. Political-independence pressure: rate decisions affect employment, asset prices, and government borrowing costs, and the committee's structure — regional presidents chosen by regional boards, governors confirmed by politicians — is a designed compromise that periodically draws fire from every direction. And the blunt-instrument critique: one rate for a continental economy transmits unevenly — housing-heavy regions feel tightening faster than others, a distributional fact acknowledged in Fed research even as the mandate stays national. None of these critiques has produced a redesign; all three produce constant tinkering at the edges.
The 2025 framework review — the Fed's periodic re-examination of its strategy, tools, and communication practices, conducted with public town halls — put several of these questions through formal process, per the Fed's published agenda. Readers who follow the review documents watch the machinery's blueprints being revised in the open, a transparency that deserves more attention than it usually receives.
How should a reader follow the Fed's machinery?
A short public stack suffices. The statement and projections publish at 2:00 p.m. on decision days; minutes three weeks later; the Desk's daily operations statement every morning; the H.4.1 weekly release shows the balance sheet, reserves, and facility usage; and the New York Fed publishes the effective funds rate daily. A reader who follows these five documents understands the rate system better than most commentary conveys — because the commentary covers the meetings, and the machinery, as this explainer has tried to show, is the part that runs every single night.
Where can readers verify everything?
The Federal Reserve's site publishes the statement archive, the dot plots, minutes, the implementation notes describing administered rates, and the Desk's reports — all free. The claims above trace to those pages, and an hour with them converts the Fed from a narrative institution into the specific, auditable machine it actually is.