
Every June since 2013, the Federal Reserve has published a full accounting of how the largest U.S. banks would fare in a hypothetical severe recession — dozens of firms, a standardized scenario, projected losses and capital ratios nine quarters forward, firm by firm, in public. The exercise anchors the largest banks' capital requirements and has become the banking system's annual public exam. Market Today publishes information, not investment advice, and this explainer covers how the test is built, what it measures, and what it cannot — ahead of the results cycle this publication covers each year.
What is the legal foundation?
The Dodd-Frank Act of 2010, which directed the Federal Reserve to run annual stress tests on banks over ten billion dollars in assets and large nonbank financial companies the council designates. The implementing framework — Regulation YY — established the Dodd-Frank Act Stress Test, known as DFAST, alongside the supervisory stress test the Fed conducts and the company-run versions banks must perform themselves. The exercise exists because pre-2008 supervision measured capital against static snapshots; the crisis taught that capital must be judged against trajectory — what happens to the balance sheet under adverse conditions over time, not merely where it stands today. Stress testing converted that principle into an annual, public, standardized procedure.
How is a scenario constructed?
By the Fed's design staff, published months in advance. Each February, the Fed releases the scenario document: a severely adverse scenario — the binding test — with a specified path for unemployment (rising sharply, historically around four to six percentage points to a peak near ten percent), gross domestic product, equity prices, and interest rates, plus a housing-price decline; an adverse scenario stressing different variables; and, since 2018, exploratory analyses probing risks without capital consequences. The scenarios are standardized across firms — every bank faces the same recession — and deliberately severe: the severely adverse path is worse than the 2008 crisis in several dimensions, a design choice meant to test capital at the system's plausible worst, not to forecast the likely year. The global component adds foreign shocks for banks with international operations.
How are the projections run?
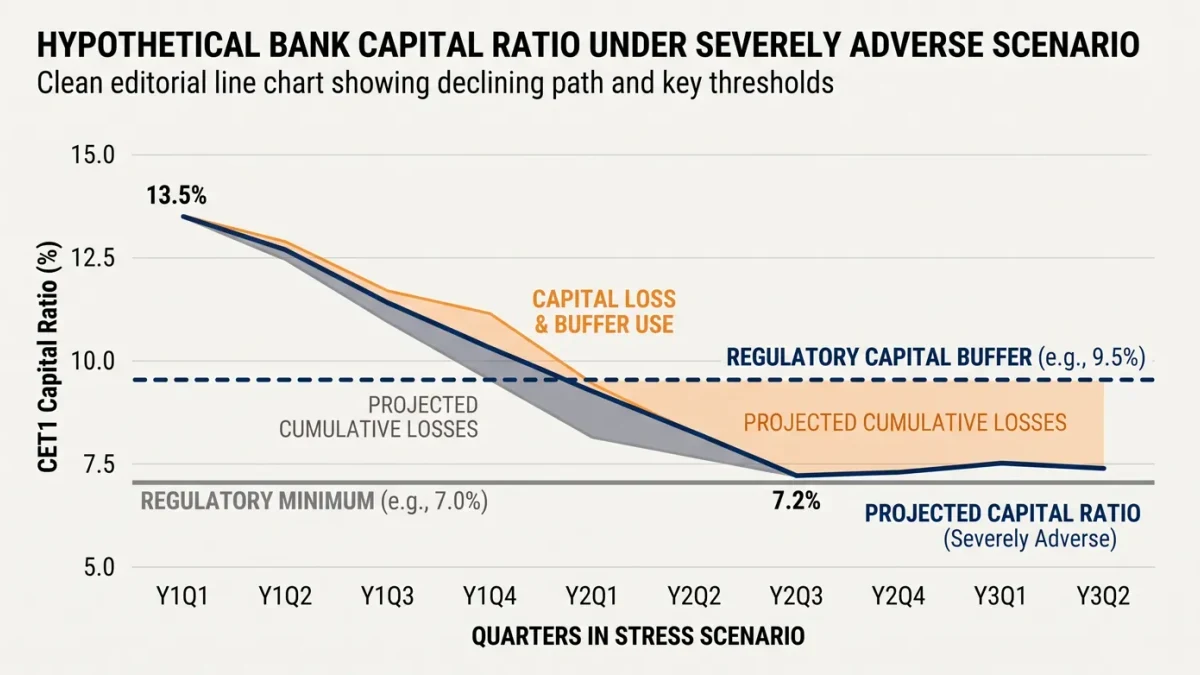
Through the Fed's supervisory models against each firm's actual balance sheet. Banks submit granular data — loan portfolios by category, securities holdings, trading positions, income statements — and the Fed's staff projects revenues, losses, and capital ratios over nine quarters under the scenario, using models the Fed itself owns and publishes documentation for. Loss rates are projected by loan type: credit cards historically lose the most, commercial real estate prominently in recent scenarios, first mortgages less; trading and counterparty losses apply to the firms with big dealer operations. The output is a capital trajectory: each firm's CET1 and other ratios from start through the nine-quarter trough, with the decline from starting point to trough — the peak-to-trough drawdown — the number that feeds the requirement. Firm-level results publish in full: the transparency is the design's signature feature and its most debated.
How do results become requirements?
Through the stress capital buffer, the mechanism since 2020. Each firm's projected peak-to-trough CET1 decline, plus planned dividends over four quarters, sets its buffer atop regulatory minimums — the steeper the projected losses, the higher the requirement that firm must hold in reality. Before 2020, a parallel exercise — the Comprehensive Capital Analysis and Review, CCAR — graded banks' own capital plans with pass-fail consequences; the SCB replaced most of that with a formula, trading discretion for predictability. The sequencing each year: February scenarios, April data submission, late-June results, banks' capital plans and payout announcements in the following weeks, new requirements effective October first — a full public cycle this publication's coverage of the 2026 results documented.
What has the test achieved?
A measurable capital build, by design. Large banks entered 2008 with roughly seven percent CET1; the stress-tested system of the 2020s holds around twelve percent, with the Fed publishing loss-absorption totals in the hundreds of billions per cycle — the 2026 exercise's nearly 708 billion dollars of projected losses absorbed above minimums being the latest entry. The 2020 pandemic offered a live validation of sorts: banks entered the shock with stress-tested buffers and remained lenders through it, a contrast to 2008 that regulators cite as the framework's core vindication, per Fed statements. The indirect effects may matter as much: the exercise standardized capital disclosure across the industry, gave markets an annual comparable dataset, and made capital adequacy a public, contested, quantified conversation rather than a supervisory private matter.
What are the honest criticisms?
Four with institutional weight. Model monoculture: one supervisory model set scoring all firms rewards conformity to the model's assumptions rather than genuine risk management — the critique banks raise most. Scenario staleness: the same severity each year becomes a curriculum banks optimize against; the counter is the exploratory scenarios' rotating risks. Procyclicality risk: buffers set on projected losses tighten capital exactly as losses materialize, an automaticity the 2020 framework softened deliberately. And coverage gaps: the 2023 regional-bank failures — firms below the largest tiers, killed by liquidity and interest-rate risk rather than loan losses — exposed that the test's loan-loss-centric lens and its size thresholds both miss failure modes the real world keeps inventing, per the Fed's own reviews. Each criticism produced modifications — averaging across scenarios from 2025-2026, exploratory modules, the liquidity and long-term-debt rules added post-2023 — the framework evolving through its critiques.
What is the difference between the Fed's test and the banks' own?
Two exams run on the same scenarios. The Fed's supervisory test uses the Fed's models and sets the buffer — the binding exercise. Separately, every bank must run its own stress test on the same scenarios with its own models, filing the internal results regulators review — an exercise built to force institutions to develop independent stress-capability rather than outsource their risk imagination to the supervisor. The gaps between the two are supervisory information: a bank whose internal models consistently project milder losses than the Fed's learns that its risk appetite is calibrated optimistically, a conversation documented in supervisory feedback. For readers, the distinction matters because bank-published stress materials — often quoted in investor decks — are the firms' own grades of themselves, while the June release is the external exam; quoting the former without the latter repeats the pre-2008 arrangement the framework was built to end.
How should readers use the annual release?
With the cycle in mind and the tables at hand. The aggregate numbers — total losses, aggregate capital decline — set the system-level tone; the firm-level tables reward comparison against each bank's own history more than against peers (business mixes make cross-firm ratio comparisons loose); and the payout announcements in the weeks after results are where the exercise meets shareholders — dividend increases and buyback expansions flowing mechanically from comfortable passes, as 2026's results showed. Readers should also file the caveats: results are projections from a standardized scenario, not predictions; the scenario is deliberately worse than the base case; and the exercise grades capital, not liquidity or management — three limitations the Fed itself states and readers should carry.
Where can readers audit the whole exercise?
Everything publishes on the Federal Reserve's site: the February scenario document, the model documentation, the June results with firm-level tables, the capital-rule mechanics of the buffer, and the annual cycle's archive back to 2013. No other major jurisdiction publishes an exam this complete — a transparency worth using, since the entire point of the design is that the public can grade the banks' stressworthiness alongside the supervisor.
And a closing calendar note for 2026 readers: this year's framework transition — scenario averaging and the related changes — makes the published numbers a new series' first observations, an occasion for extra caution in year-over-year comparisons that the Fed's own documentation acknowledges. The exam keeps improving; the grade boundaries keep moving; reading both is the discipline.